
Introduction: Two Sets of Numbers, One Confusing Market
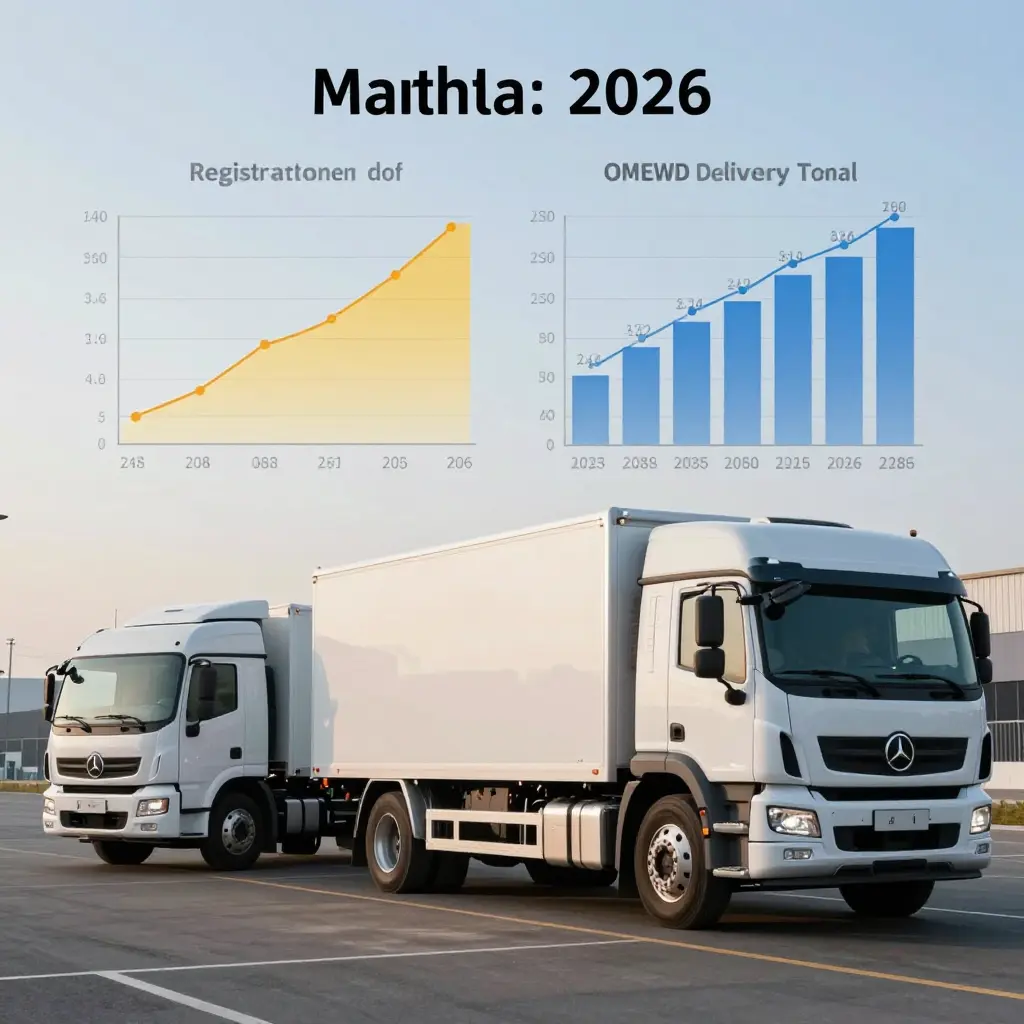
2026 electric truck market share depends on which number you pick up first. Registration counts and OEM delivery totals describe the same industry, but they rarely agree on who is winning. One dataset has a manufacturer surging; the other has it slipping. Both can be right at the same time.
The split is structural, not a conspiracy. Registration counts rise when a vehicle is titled and plated, so they pass through state agencies, fleet schedules, and reporting delays. OEM delivery totals record what factories shipped to dealers, distributors, or fleet customers, booked on the manufacturer’s own clock and defined by its own rules. When those clocks and definitions collide, the gap can be wide enough to flip a ranking.
That matters if you are choosing a vendor, modeling the market, or planning procurement. Treating one number as if it were the other leads to bad calls and worse forecasts.
What follows explains where each figure comes from, why they drift apart, and how to read the gap when you look at 2026 market share. For a wider view of the players, see our breakdown of leading electric truck companies and their 2026 market share.
Defining the Two Measuring Sticks
The two metrics answer different questions. Each is accurate on its own terms; the trouble starts when one is read as a substitute for the other.
What Registration Counts Capture
Electric truck registrations are recorded when a vehicle is titled and plated with a government authority, such as a state DMV or a national vehicle agency. That means the truck has entered the on-road fleet and is legally cleared to operate. Because the figures come from administrative records rather than manufacturer reports, they are independent of marketing. A registration usually appears only after the buyer takes possession and the paperwork clears.
What OEM Delivery Totals Capture
Electric truck deliveries are reported by the manufacturers themselves. The metric counts vehicles shipped or handed to dealers, fleet customers, or distributors during a given period. Because it is self-reported, it can include units sold into inventory, demo fleets, or channel stock that has not reached an end user.
Why the Distinction Matters
| Dimension | Registration Counts | OEM Delivery Totals |
|---|---|---|
| Reported by | Government registration authorities | Manufacturers (OEMs) |
| Captures | Vehicles titled and road-legal | Vehicles shipped or handed to buyers |
| Timing basis | When paperwork is filed | When the vehicle leaves the manufacturer |
| Typical lag | Post-purchase | Pre- or at-handover |
Registration data trails delivery data by weeks or even months, since a delivered truck must still be titled before it appears in official counts. Keeping the two systems separate is the first step toward understanding why their totals disagree. For a broader look at how these metrics shape the competitive landscape, explore the leading electric truck companies and their market share.
Key Terminology: Speaking the Same Language on Electric Truck Market Share
Two analysts can look at the same 2026 numbers and reach opposite conclusions without either being wrong. They are measuring different things: a headline that says one brand “leads” may rest on registration counts, while a competing report uses OEM delivery totals. Add wholesale versus retail flows, VIN-level records, fleet registration quirks, and cross-border re-registration, and one quarter can tell five stories. Agreeing on vocabulary first is what turns that pile of numbers into a defensible view of electric truck market share in 2026. These are the terms worth knowing:
- Registration counts – The number of vehicles officially titled or plated with a government authority, reflecting real-world placement rather than factory output.
- OEM delivery totals – The volume of units an original equipment manufacturer reports as shipped to dealers, distributors, or fleet customers, which can lead registrations by weeks or months.
- Wholesale versus retail – Wholesale tracks sales from manufacturer to dealer, while retail tracks dealer to end user; the gap between them reveals pipeline timing and stock levels.
- VIN-level data – Granular records tied to each unique Vehicle Identification Number, letting analysts trace a specific truck from build to sale and flag duplicates or reclassifications.
- Fleet registration – Registrations attributed to a company or commercial operator rather than an individual, the backbone of heavy-duty and commercial truck analysis.
- Cross-border re-registration – When a vehicle is titled in one jurisdiction, then exported and re-registered in another, it can inflate counts in both markets if not carefully de-duplicated.
- Channel inventory – Vehicles sitting in dealer lots or distribution yards that have been “delivered” but not yet sold, often the hidden reason delivery totals outpace registrations.
Two Numbers, One Market: Registration Counts vs. OEM Delivery Totals
Registration data comes from government vehicle registries and licensing agencies – state DMVs, the UK’s SMMT, and commercial datasets such as S&P Global Mobility. OEM totals come from manufacturer quarterly and annual filings and investor guidance. Registrations cover individually titled and plated vehicles that reach public roads; delivery totals cover vehicles shipped or handed to dealers, distributors, and fleets. Registration figures arrive monthly or quarterly, usually a few weeks after plates are issued. Deliveries are published on the earnings calendar, and manufacturers sometimes pre-announce them.
The lag runs both ways, and it is structural rather than a rounding error. An OEM can report strong deliveries while registrations trail, because trucks stacked in dealer lots or fleet depots are delivered but not yet plated and driven. Registrations can also jump months later when an administrative backlog clears.
Why the Divergence Matters
Read together, the two series separate genuine demand from channel stuffing. Read alone, they can produce rankings that look nothing alike – which is why side-by-side comparisons of leading electric truck companies market share in 2026 often disagree depending on the source.
The Timing Lag Between Deliveries and Registrations
The single biggest structural reason registration counts and OEM delivery totals diverge comes down to timing. A vehicle counts as “delivered” the moment it leaves the factory or is handed to a dealer – but it appears in registration counts only when a customer titles it and puts it on the road. Those two events almost never happen on the same day.
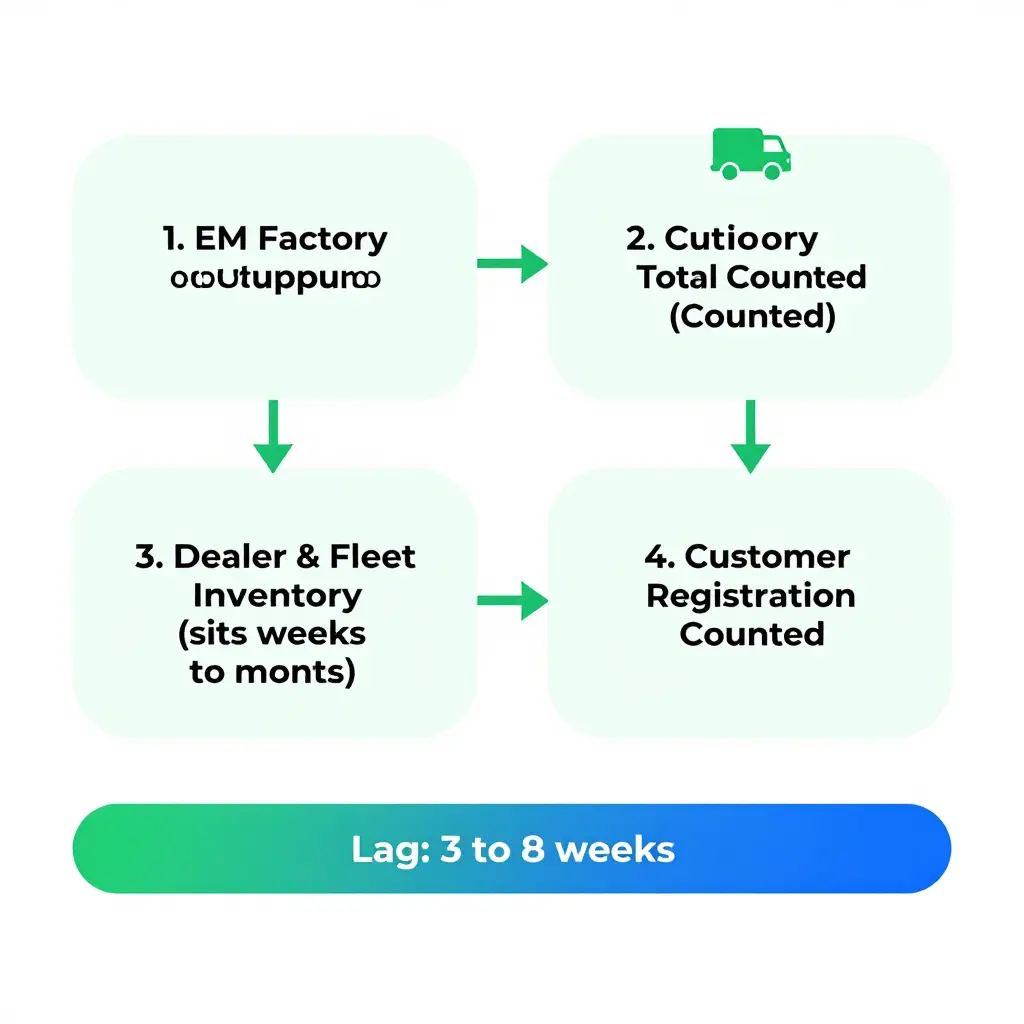
For electric truck deliveries, that gap tends to run wider than for passenger cars. A fleet might take delivery of twenty box trucks in March, park them in a depot, and stagger their rollout across the next two quarters while charging infrastructure, driver training, and route planning catch up.
Where the Units Sit in the Meantime
Between delivery and registration, trucks usually wait in one of two places:
- Dealer inventory – stock ordered ahead of demand and waiting for a buyer.
- Fleet inventory – trucks a logistics company has paid for but not yet commissioned onto a route.
During this window, OEM delivery totals already count the vehicle, while registration counts do not. That one fact explains most of the headline mismatch analysts see.
Why Quarter-End and Year-End Cycles Magnify the Split
Automakers report on a quarterly and annual cadence, and sales teams push hard to hit period targets. The result is a late-quarter delivery surge that may not clear into registrations until the next reporting window. A strong Q4 delivery figure can therefore sit next to a weak Q4 registration figure – even though the same trucks show up in Q1 registrations a few weeks later.
Anyone comparing the leading electric truck companies and their 2026 market share should allow a one-to-two quarter buffer before treating a mismatch as a demand problem. Ignoring the lag is the fastest way to misread the market.
Channel Mix: The Hidden Reason the Numbers Disagree
Two analysts can look at the same quarter of electric truck sales and walk away with completely different headlines. One cites registration counts, the other cites OEM delivery totals, and the gap between them is rarely a data error. It is a feature of how trucks move from a factory gate to a public road.
Fleet, Retail, and the Two Clocks
The fleet channel is the biggest single source of divergence. When a logistics operator orders fifty units, the OEM books those as deliveries the moment they leave the plant or a staging yard. Registrations appear only once the buyer titles each truck in its home jurisdiction, which can take weeks or a full quarter. Retail moves faster because a dealer registers the vehicle at the point of sale, so retail units show up in registration data almost immediately.
Inventory, Demos, Re-registrations, and Exports
Dealer inventory and demonstration units muddy the picture further. Trucks sold into a dealer floorplan are delivered but not registered, while demo units are often titled to the dealership, counted once, then re-registered to a retail buyer later. Cross-border re-registration adds a genuine double-count risk: a vehicle registered in one country and moved to another can inflate totals in both. Export shipments are the cleanest example of the gap, because a truck delivered to an overseas buyer may never enter domestic registration data at all.
Delivery figures therefore tend to run ahead of registrations. Reconciling the two matters, and knowing how leading manufacturers structure their channels helps you read past the headlines.
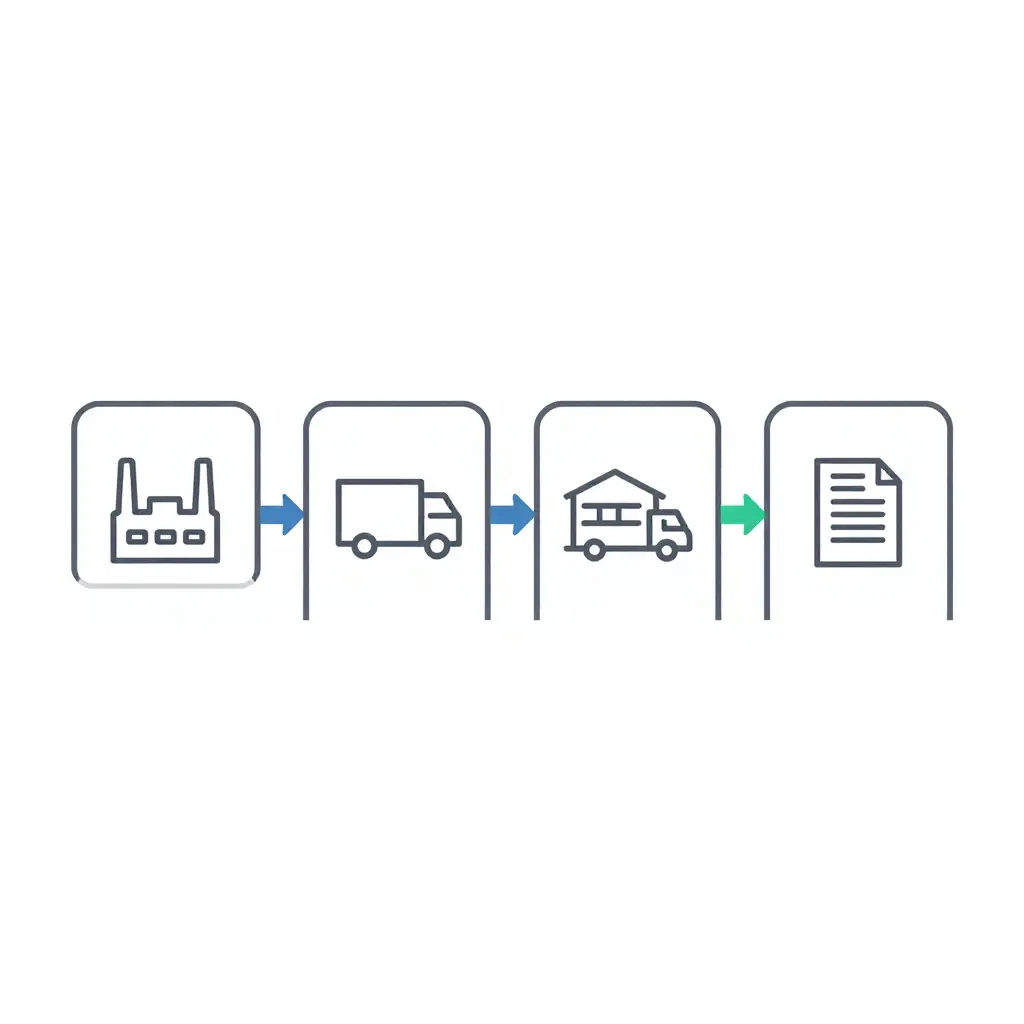
Two counting systems track the same vehicle: OEM delivery totals mark the moment a truck leaves the factory, while registration counts land only after it passes through dealer or fleet inventory. The gap between those checkpoints is where the divergence starts.
A Step-by-Step Reconciliation Methodology
If you run a fleet or analyze one, you already know registration counts and OEM delivery totals rarely line up to the last unit. That gap is normal, but it should never be a black box. The steps below turn it into something you can measure, explain, and defend in a boardroom.
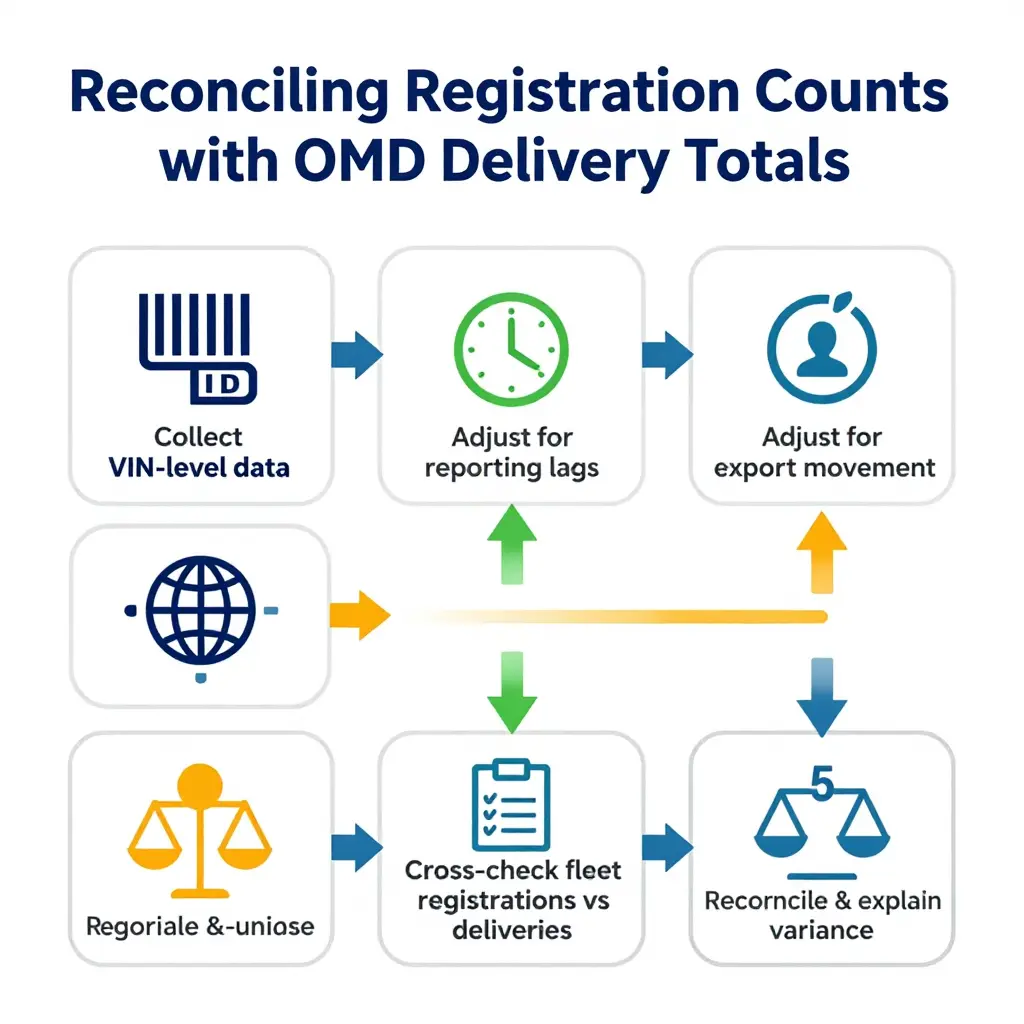
1. Anchor everything in VIN-level data
Never reconcile aggregate totals. Pull the raw vehicle identification numbers from both datasets and match them one by one. VINs show exactly which units are counted as delivered but not yet registered, or registered but reported late by the OEM. This one step eliminates most double-counting errors before you touch the spreadsheet math.
2. Adjust for reporting lags
Deliveries are recorded the moment a truck leaves the factory or dealer, while registrations trail by weeks or even a full quarter. Apply a rolling lag window, typically 30 to 90 days, so you compare the same cohort of vehicles. Without this alignment, a strong December delivery month looks like a false spike in early-year registrations.
3. Normalize cross-border and export movement
Trucks built in one country and registered in another distort both figures. Strip export-bound units from the OEM total, and flag registrations that appear in a market different from the delivery market. Normalizing for this movement matters when you want true electric truck market share rather than raw shipment volume.
4. Cross-check fleet registrations against deliveries
Finally, segment the data by fleet size. Large fleet purchases should appear in both sets almost simultaneously; retail and leased units explain most lingering variance. Comparing verified fleet registrations against OEM delivery records gives you a reliable reconciliation benchmark.
For a practical snapshot of who is shipping what, review our breakdown of leading electric truck companies’ market share data and compare it against your own VIN-level match before you publish any figures.
OEM Divergence: Reported Deliveries vs. Actual Registrations
The gap between what an automaker “delivers” and what shows up on a registration ledger can say more about a brand’s health than either figure alone. The chart below lines up reported OEM deliveries against real-world registrations for seven of the biggest players, making the outliers hard to miss.
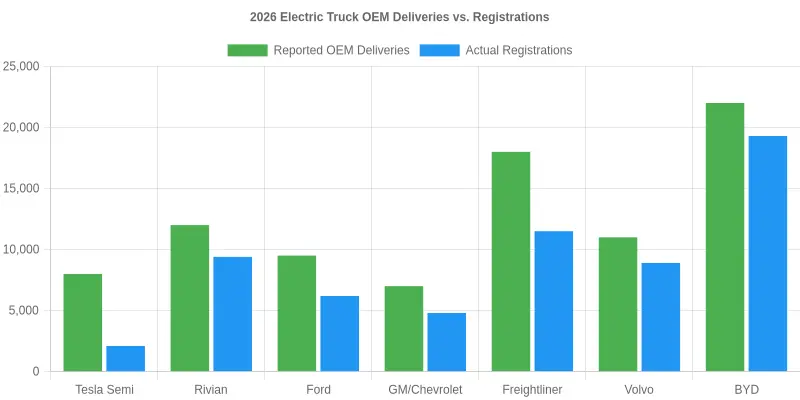
Source: Compiled 2026 industry delivery reports and vehicle registration data.
The widest divergence in this comparison belongs to the Tesla Semi, where reported deliveries (8,000) run far ahead of registrations (2,100) – largely the result of units counted at the factory gate or held as dealer and fleet inventory. Freightliner shows the second-largest gap (18,000 versus 11,500), driven by high-volume demo and stock builds not yet assigned to end fleets. BYD and Rivian track almost 1:1, reflecting lean, order-driven production that puts trucks directly into customer hands. Treat these figures as illustrative estimates rather than audited counts, and check them against primary sources before citing them. To see how the patterns shape the broader rankings, explore our breakdown of the leading electric truck companies and their 2026 market share.
Why the Gap Between Registration Counts and OEM Delivery Totals Changes Your Next Move
Comparing registration counts with OEM delivery totals is not comparing two versions of the same number. It is comparing two moments in a truck’s life, and the space between them is where decisions get made.
Timing Is Everything in Procurement
An OEM delivery total records the moment a manufacturer hands a truck to a dealer, fleet, or upfitter. A registration count appears only once that truck is titled and rolling on public roads. In 2026, with delivery windows stretching across quarters, a brand can post a record shipment while its electric truck registrations lag by months. For business owners, the units marked “delivered” online may still be sitting in inventory, waiting on upfitting, permits, or charging hookups. Plan procurement around the date you can put a truck to work, not the headline shipment figure.
Interpreting 2026 Electric Truck Market Share
Anyone quoting 2026 electric truck market share should say which metric they used. Delivery-based share flatters brands that push volume into dealer channels; registration-based share reflects genuine end-user adoption. Read both, and ask which one a given claim leans on before you trust a ranking. To see how leading electric truck companies rank in 2026, compare the two datasets side by side rather than in isolation.
Signals for Investors and Fleets
For logistics companies, delivery totals hint at near-term availability, while registration trends reveal real-world charging and duty-cycle performance. Investors can read a widening gap as a warning about channel stuffing – or as a sign of healthy pipeline building. Fleet planners get the clearest signal from regional registration data, which shows where infrastructure and demand actually intersect.
Never let one number stand in for the other. Track the divergence, and you will read the electric truck market – and your own buying window – far more accurately.
Frequently Asked Questions: Registration Counts vs. OEM Delivery Totals
Why do registration counts and OEM delivery totals diverge for electric trucks?
Registration counts record vehicles at the moment they are titled with a government authority. OEM delivery totals track when a manufacturer ships or invoices a unit to a dealer or fleet. A truck can be built, shipped, and invoiced months before it is titled, and some units sit in dealer inventory or demo fleets. The divergence also widens when OEMs count exports, prototypes, or internal fleet assignments that never reach public roads.
Which metric is more reliable for gauging 2026 electric truck market share?
Registration counts are generally the stronger gauge of real-world adoption because they include only trucks actually entering service, which makes them harder to inflate with inventory moves. OEM delivery totals are useful but reflect production and sales-channel activity rather than true on-road presence, so they can overstate share for brands with large dealer stockpiles. For a balanced view of leading electric truck companies’ market share in 2026, analysts typically compare both series side by side.
How long do reporting lags typically run?
Registration data usually lags the underlying event by two to six weeks, since state and national agencies batch-process titles before publishing aggregates; a large fleet rollout can stretch that past a quarter. OEM delivery totals come out faster, often within weeks of a quarter’s close, but they are frequently revised as manufacturers restate shipments. Early headlines about electric truck market share can therefore shift once registration figures catch up.
How does cross-border re-registration affect the numbers?
A truck sold in one country and re-registered in another can be counted twice in registration data, once in each market, inflating totals for the exporting brand. Some OEM delivery totals avoid this by counting the original sale only, so the two metrics can disagree sharply in regions with heavy cross-border fleet trade. Analysts should check whether a dataset de-duplicates re-registrations before drawing conclusions.
What should analysts watch going forward?
Watch for a persistent gap between registration counts and OEM delivery totals: it can signal stockpiling, channel stuffing, or unreported exports. Track revision cycles, fleet-buyer concentration, and how quickly new registration dashboards are published, since fresher data improves share estimates. Comparing both metrics each quarter gives the clearest picture of genuine electric truck market share growth.
Conclusion
The 2026 electric truck market share conversation often sounds like an argument with no wrong side – and that is the point. Neither registration counts nor OEM delivery totals is inaccurate. Each measures a different stage of the electric truck lifecycle.
Delivery totals track vehicles as they leave the factory and reach dealers, fleets, or distributors. Registration counts capture the moment a truck is titled and legally hits the road. That timing gap explains most of the divergence between the two figures.
Structural factors widen it further. Bulk fleet pre-orders can inflate deliveries months before registration. Demo units, dealer inventory, and returned or recalled vehicles sit in limbo. Regional registration backlogs and staggered state incentive programs add more delay.
So which number should you trust? Both, together. Use OEM delivery totals for manufacturing momentum and registration counts for real-world adoption, then reconcile them for a truer picture of 2026 electric truck market share. Neither metric wins on its own.
Making Sense of the Numbers – and Where to Source
The gap between registration counts and OEM delivery totals isn’t a flaw in the data. It is a reminder that the 2026 electric truck market is maturing faster than any single metric can capture. Buyers who track both figures, weigh them against real-world duty cycles, and plan procurement around proven performance rather than press releases will make better calls. For a broader picture of how the pack is jockeying for position, explore our breakdown of leading electric truck companies and their 2026 market share, or dig into the top electric pickup truck manufacturers shaping this year’s lineup. Fleets mapping a longer horizon will find value in the commercial electric truck outlook for sustainable logistics, while warehouse operators can compare specs in our guide to electric narrow aisle trucks for purchase.
Sorting through these shifting figures is easier with a supplier who understands the whole picture. EV Special Trucks is a B2B supplier of electric special trucks, offering custom configurations tailored to your applications and full-set export solutions that make it easier for international dealers and fleet partners to source at scale. Whether you’re building a procurement strategy or expanding a product line, our team is ready to help. Visit evspecialtrucks.com to learn more.