
Why Advertised Range Misleads: Sizing Hydrogen Fuel Cell Range Extenders to Route Energy
A hydrogen fuel cell range extender is an on-board auxiliary power unit. It turns stored hydrogen into electricity to supplement a truck’s battery-electric drivetrain. On a heavy-duty truck it works as a range-management tool rather than the primary powertrain, and its value depends on how closely it is matched to the duty it serves. Start with where these systems fit inside broader hydrogen fuel cell trucking strategies, because no sizing decision makes sense outside that context.
Route energy demand is the total traction and auxiliary energy a truck burns over a defined route, measured in kilowatt-hours under real payload, grade, and climate conditions. It is something you measure, not a nameplate rating. Advertised range is the opposite: a single idealized figure, usually produced on a favorable test cycle.
Stack sizing is the work of matching stack power and hydrogen storage to that measured demand, with a defined energy reserve. Size a truck to advertised range instead and you get one of two failures: overbuilt and heavy, or underpowered and stranded. That mismatch is still the problem the industry under-addresses.
The method below lets fleet managers and powertrain engineers specify a hydrogen fuel cell range extender against real duty cycles instead of optimistic range claims.
Route Energy Demand: The Metric That Actually Sizes the Stack
Advertised range reads like a promise. It comes out of a standardized test cycle run at fixed speed, temperature, and payload. Route energy reads like an invoice. It reflects what one truck on one corridor actually consumes.
On heavy-duty trucks the gap between the two is not a rounding error. It is the difference between a stack that holds up on Monday morning and one that strands a driver on Friday night.
Route Energy Is Composed in Layers
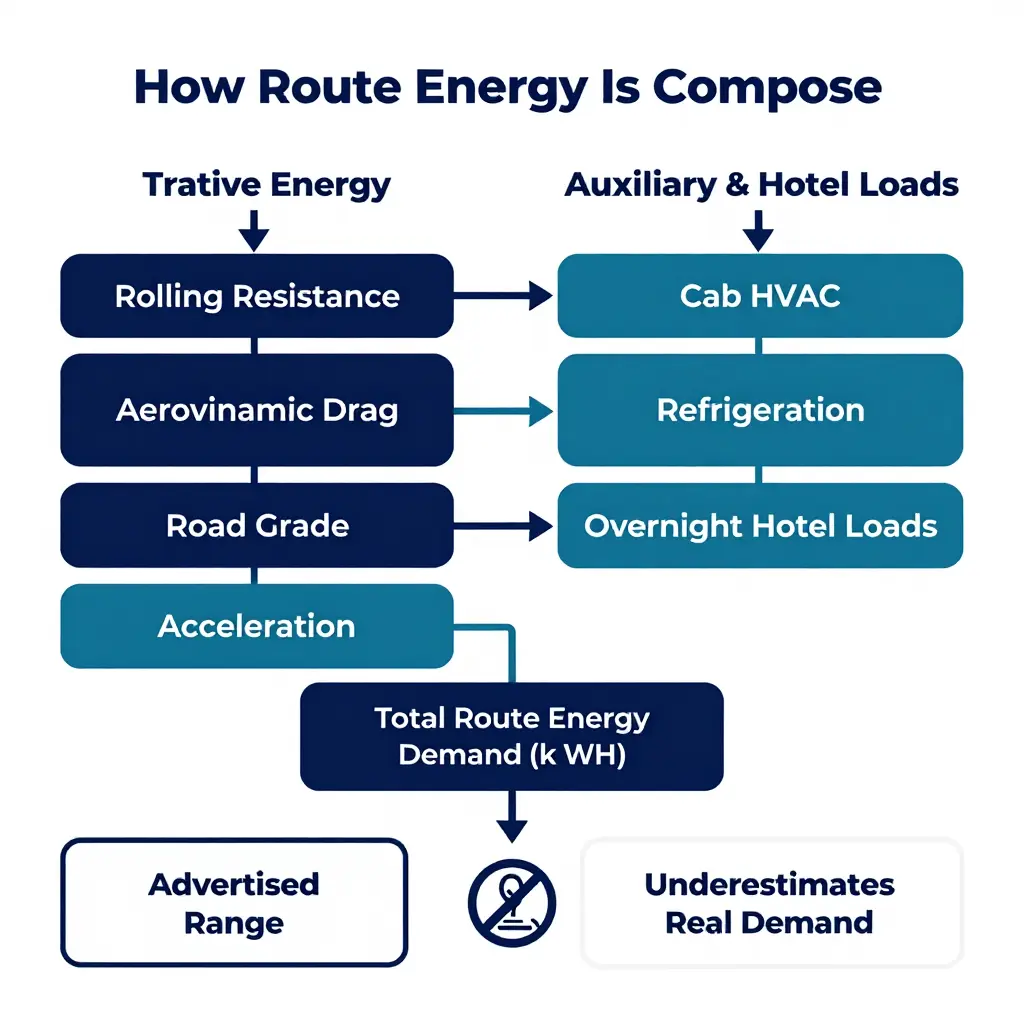
Route energy splits into two families: tractive energy at the wheels, and auxiliary plus hotel loads. Tractive energy comes first, because it dominates whenever the truck is moving.
- Rolling resistance. Every tire deforms against the road. Rolling losses scale with payload mass and roadway surface. A fully loaded 40-tonne combination wastes far more energy here than a bobtail tractor.
- Aerodynamic drag. Drag rises with the square of speed and with frontal area. At highway velocity it becomes the single largest tractive loss for a Class 8 tractor-trailer.
- Road grade. Climbing stores potential energy (m·g·h). A 3% grade held for ten miles adds demand that a flat test cycle never captures, and descending rarely recovers all of it.
- Acceleration. Stop-and-go duty cycles convert energy into kinetic motion repeatedly. Urban delivery routes penalize mass far more harshly than steady interstate cruise.
- Payload mass. Mass multiplies both rolling resistance and grade demand, so two identical trucks with different loads produce two different route energy values.
- Ambient temperature. Cold air is denser (more drag), tires stiffen (more rolling loss), and batteries deliver less usable energy. Winter quietly inflates the requirement.
- Auxiliary and hotel loads. Cab HVAC, refrigeration units, pumps, inverters, and overnight hotel loads draw energy whether the truck rolls or not. For a sleeper idling at a rest stop, these loads can rival traction across a full shift.
| Energy component | What drives it | Route impact |
|---|---|---|
| Rolling resistance | Mass, tire, surface | Rises with payload |
| Aerodynamic drag | Speed squared, frontal area | Dominant at highway speed |
| Road grade | Elevation change (m·g·h) | Huge on hilly corridors |
| Acceleration | Mass, stop frequency | Worst in urban duty |
| Ambient temperature | Air density, battery output | Winter inflates demand |
| Auxiliary & hotel loads | HVAC, refrigeration, idle | Persists when stopped |
Why One Advertised Number Cannot Size a Stack
Stack sizing has to cover the highest route energy a truck will ever face, not the average. A single advertised range folds idealized conditions into one figure and hides the worst case.
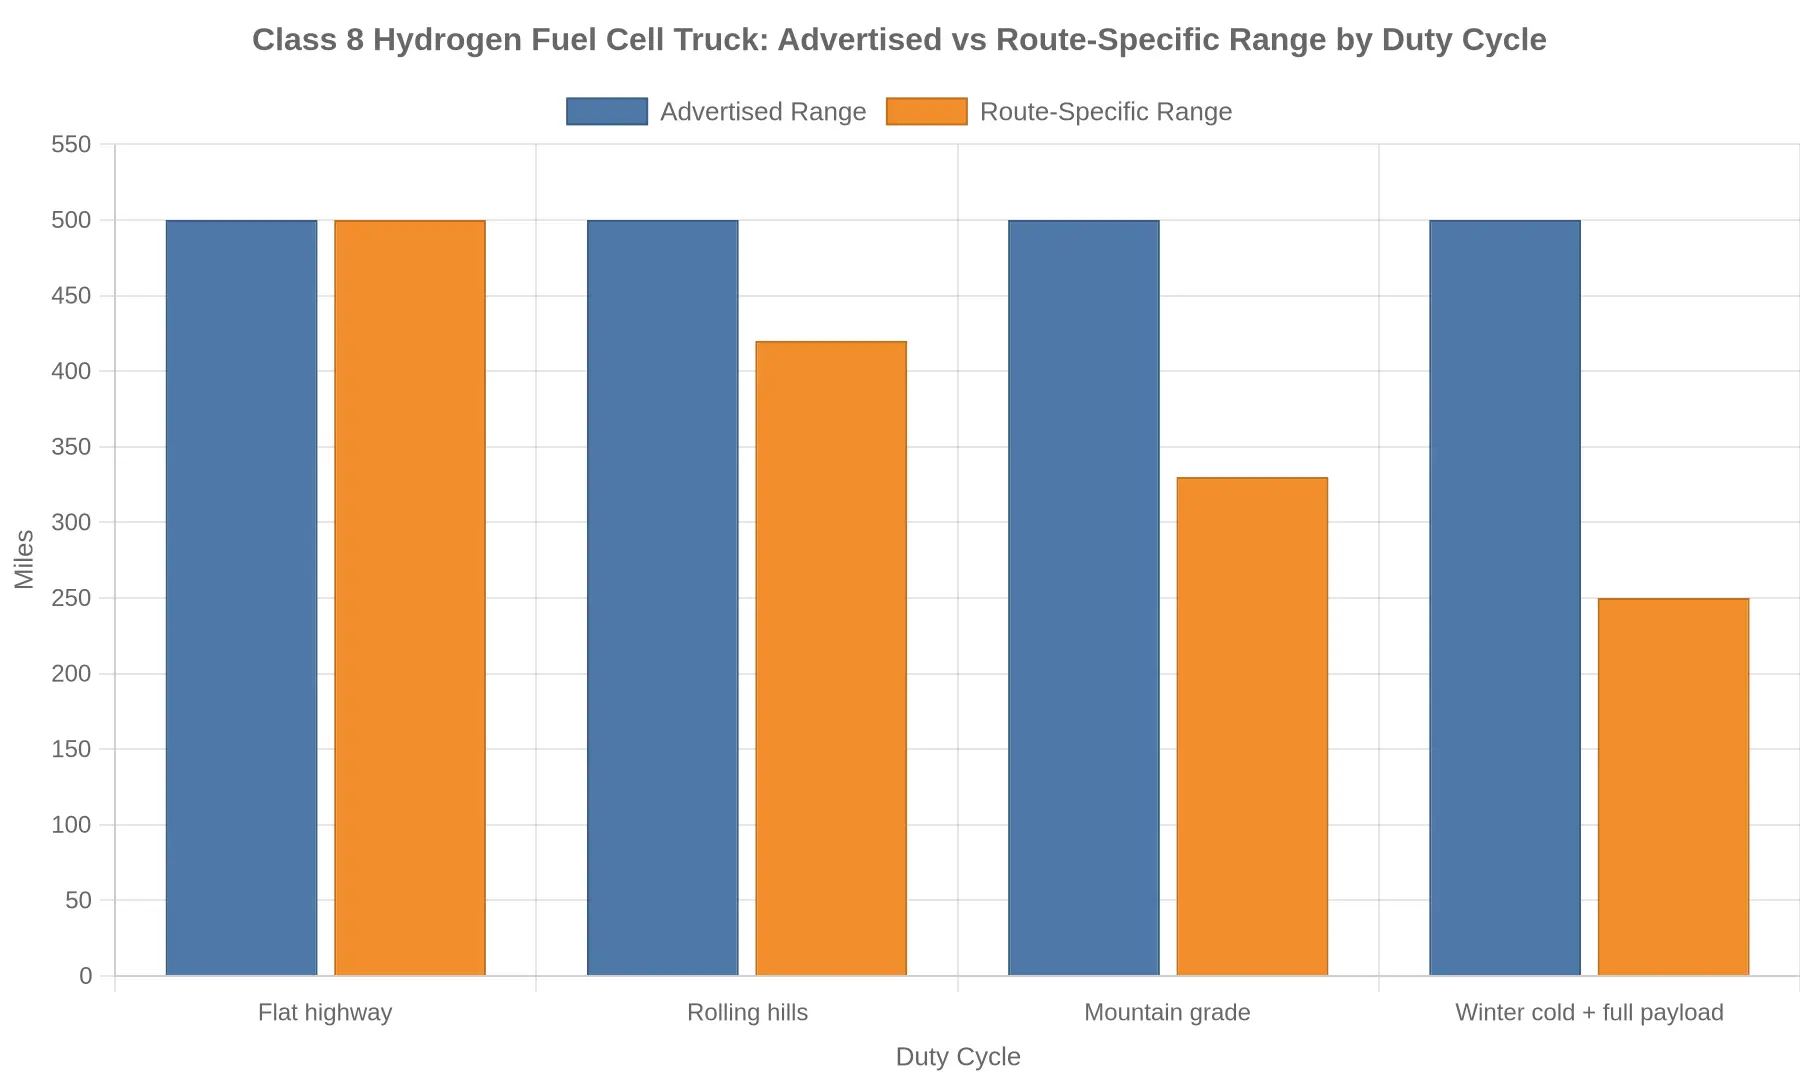
The chart above makes the problem concrete. The same Class 8 truck advertises 500 miles, yet real route energy demand can cut that to 250 miles in winter with a full payload. A stack sized around the advertised figure would run out of hydrogen before the route is done.
Stack sizing therefore has to be driven by route energy, not marketing range. An engineer who models the worst-case corridor, the heaviest payload, and the coldest morning ends up with a stack that actually works. The same logic runs through hydrogen fuel cells for sustainable trucking deployments, where real duty cycles rather than lab cycles decide whether a fleet delivers.
Advertised Range Versus Route-Specific Energy Demand Across Representative Duty Cycles
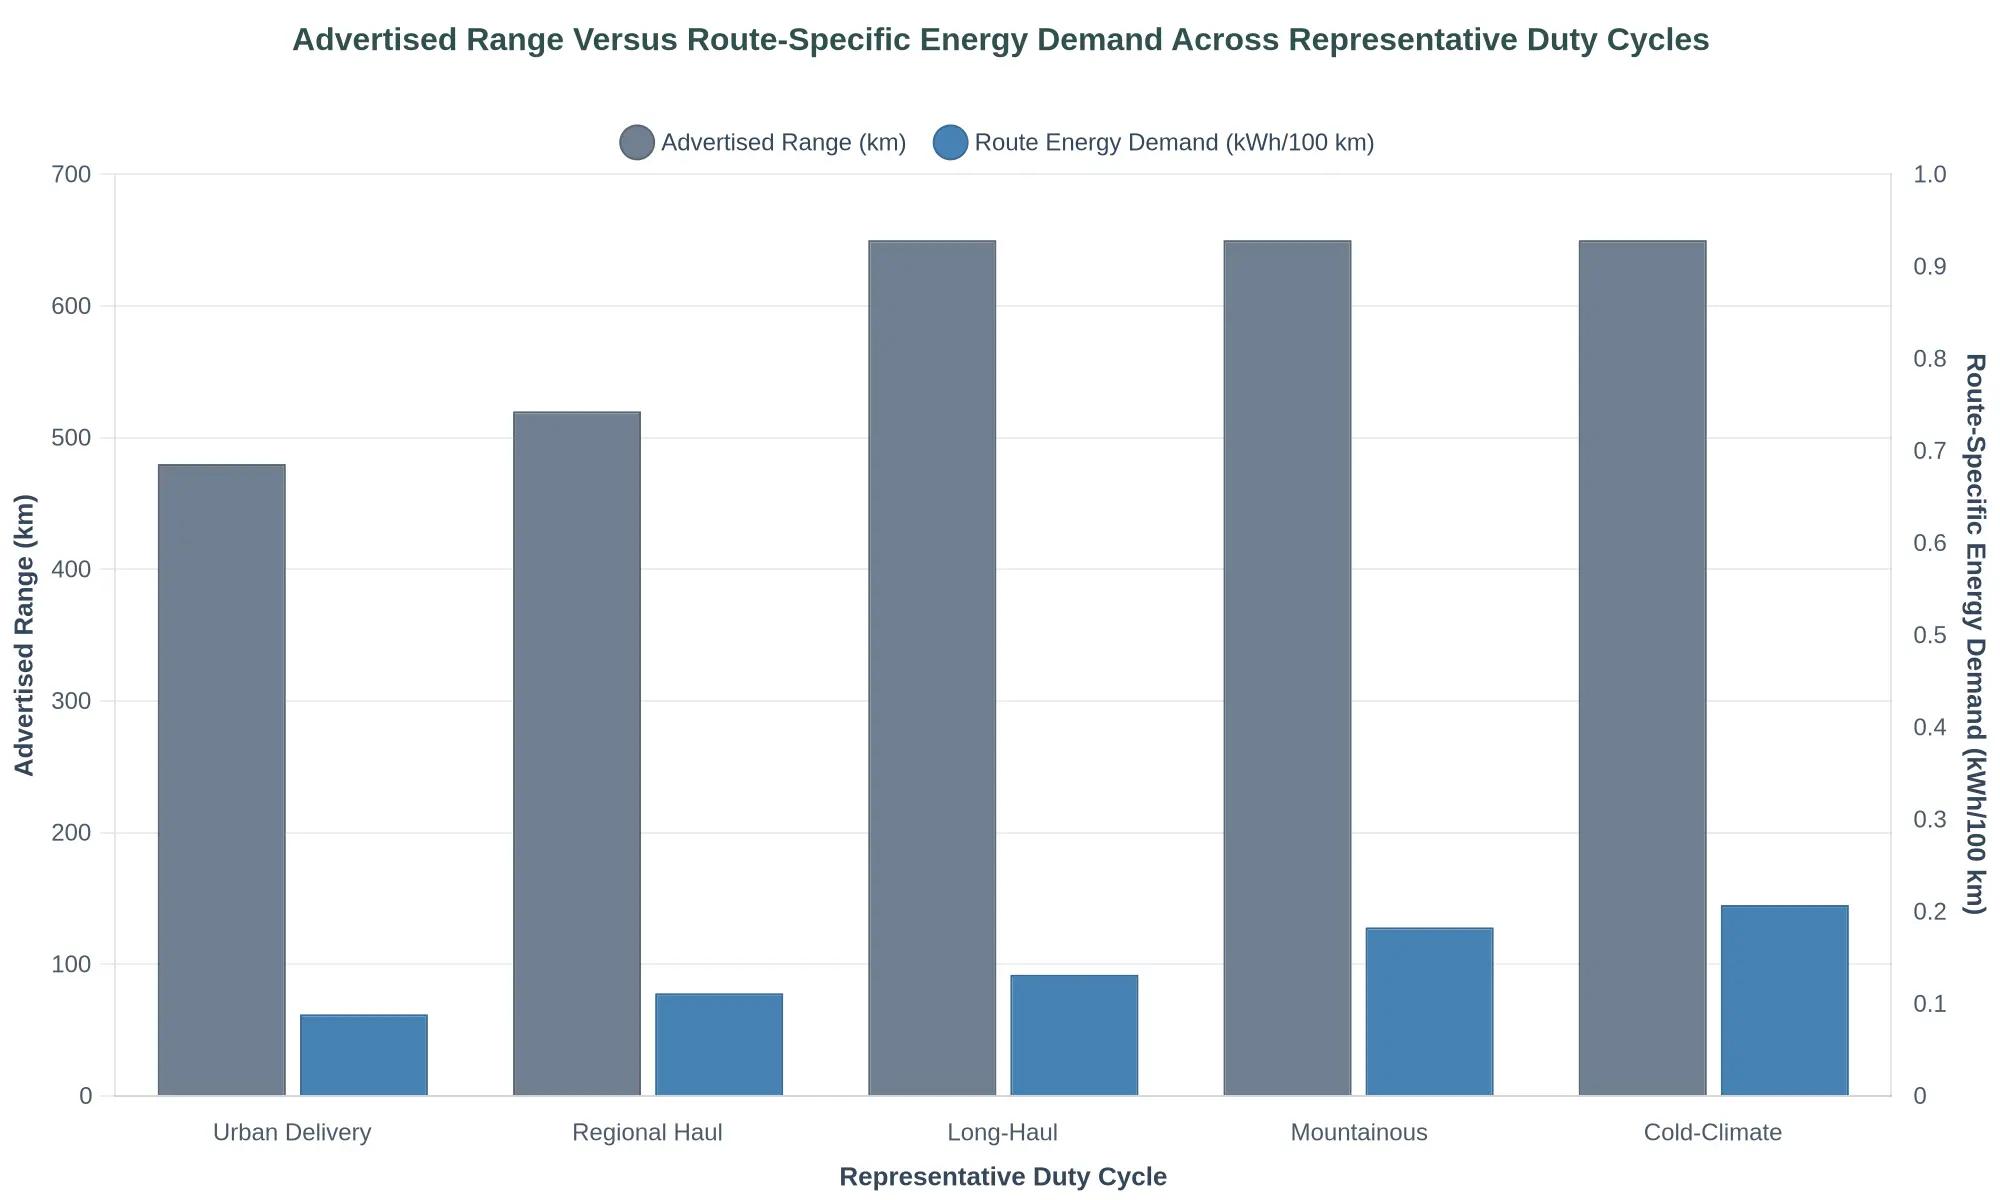
Figure 1. Advertised range (grey bars, left axis, km) versus route-specific energy demand (blue bars, right axis, kWh/100 km) across five representative duty cycles.
The chart points to a structural problem with range-based sizing: advertised range is one nominal number, while route energy demand depends on the duty cycle and climbs steeply with grade, speed, and ambient conditions.
| Duty Cycle | Advertised Range (km) | Route Energy Demand (kWh/100 km) |
|---|---|---|
| Urban Delivery | 480 | 62 |
| Regional Haul | 520 | 78 |
| Long-Haul | 650 | 92 |
| Mountainous | 650 | 128 |
| Cold-Climate | 650 | 145 |
The Takeaway
Sizing a fuel cell range extender against the advertised range figure underestimates real demand. The advertised-range bars stay essentially flat across long-haul, mountainous, and cold-climate profiles, while the energy-demand bars more than double from urban delivery to cold-climate operation. An engineer who sizes the stack against the advertised number in a cold-climate or mountainous duty cycle will underspecify the system and leave the truck energy-starved on its hardest routes. The correct input is route-specific energy per 100 km, measured or modeled for the actual duty cycle, then multiplied by the daily route length plus a defined reserve. For background on how these fuel cell systems fit within broader fleet decarbonization, see this overview of hydrogen fuel cell trucking.
A Four-Step Methodology for Sizing the Fuel Cell Stack to Route Energy
Advertised range figures rarely survive contact with a real duty cycle. To size a range extender correctly, engineers have to reverse the problem: instead of scaling a vehicle to a marketing number, they scale the stack to the energy the route actually demands. Teams without deep hydrogen experience can start with the fundamentals of hydrogen fuel cells in trucking. The four steps below keep sizing tied to physics rather than brochure promises.
-
Measure or model route energy demand. Convert the route’s distance, grade profile, payload, and ambient conditions into total tractive energy, using logged telemetry or a validated simulation. Distance alone says nothing about how much work the truck has to do.
-
Define average and peak power requirements. Turn that energy demand into a continuous average power target and a short-duration peak power profile, so the stack matches sustained cruise loads without being overbuilt for brief surges.
-
Apply derating and degradation margins. Add altitude, temperature, and end-of-life losses through a defined degradation margin, so the stack still meets demand after several years of service rather than only on day one.
-
Validate against battery buffer and refueling constraints. Confirm that the battery buffer absorbs transient peaks and captures regenerative braking energy, and that the depot’s refueling cadence fits the real schedule. That closes the loop between stack output and everyday fleet operations.
Run in order, these steps leave you with a stack sized on measured energy, disciplined power, and conservative margins rather than the range printed on a spec sheet.
Key Variables That Change Route Energy
Route energy for a heavy-duty truck is not a constant. It is the integral of instantaneous road-load power over distance. Five variables dominate how that integral shifts per unit of travel, and each maps to a tractive-force term an engineer can model. The chart below ranks their approximate impact on energy per kilometer against a baseline flat, fully loaded highway cruise.
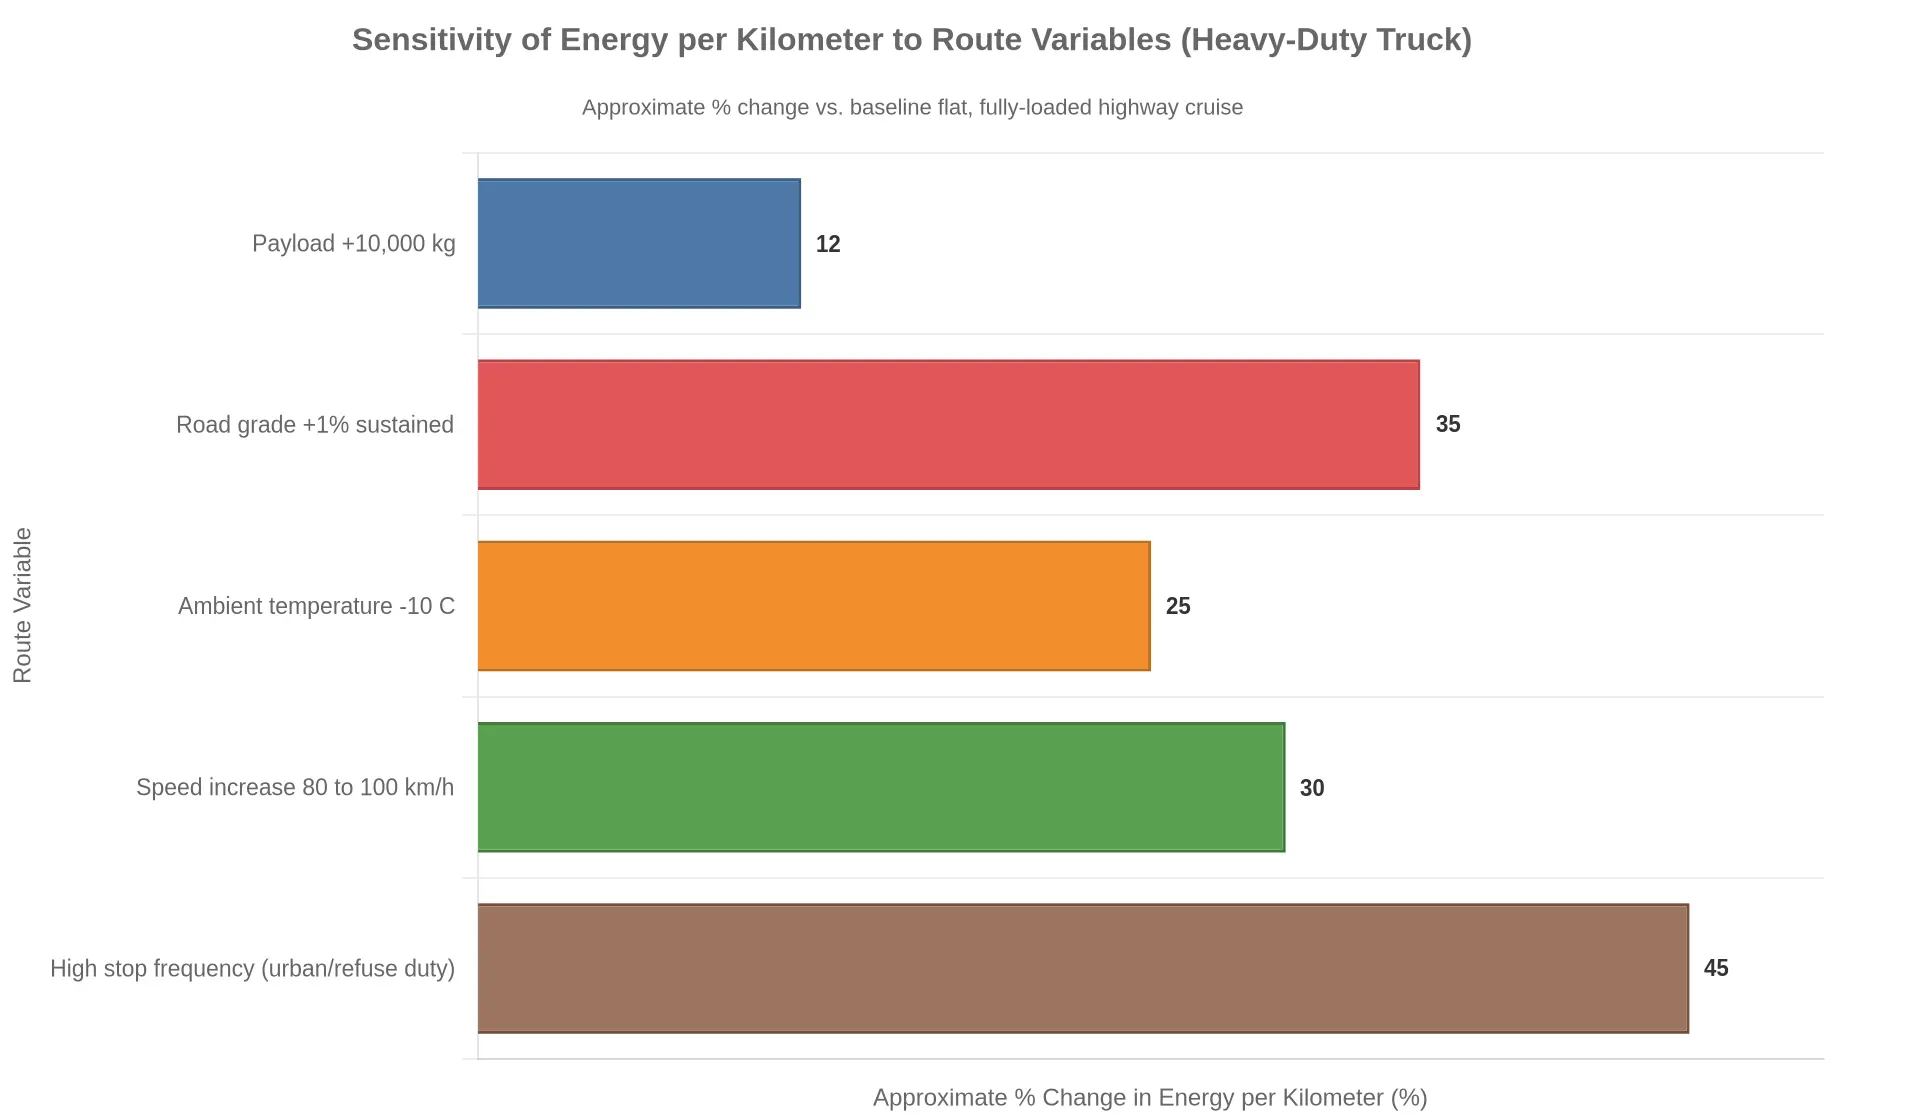
Payload mass. Rolling resistance scales linearly with mass (Frr = Crr x m x g), so extra payload raises that term in direct proportion. Adding 10,000 kg at Crr of about 0.006 adds roughly 588 N of rolling force; on a grade the gravitational term (m x g x sin theta) grows the same way, compounding the penalty.
Road grade. Grade adds a sine-weighted gravitational load and is independent of aerodynamic losses. A sustained 1% grade on a 40,000 kg combination demands an extra ~3.9 kN of tractive force, enough to lift energy per kilometer by a third or more over flat running.
Ambient temperature. Cold air is denser and raises rolling resistance, while cab heating, battery conditioning, and lower hydrogen utilization take their own cut. Below 0 C, these effects commonly add 15-30% to route energy.
Speed profile. Aerodynamic drag scales with velocity squared (Fdrag = 0.5 x rho x v^2 x C_d x A). Cruising at 100 instead of 80 km/h can add 30%+ to per-kilometer demand, which makes top speed a first-order sizing lever.
Duty-cycle stop frequency. Every stop dissipates kinetic energy (E = 0.5 x m x v^2). A refuse route with hundreds of stops can spend 40-50% more energy per kilometer than highway duty, a decisive input for any hydrogen fuel cell powertrain sized against real route energy rather than advertised range.
Those five variables set the energy-per-kilometer profile the stack and buffer have to satisfy. A nameplate mileage figure does not describe it.
Where the Sizing Question Actually Lives: The Energy Flow Architecture
Before anyone argues over kilowatts or tank kilograms, it helps to agree on the path the energy takes. The schematic below traces that path through a hydrogen fuel cell range extender truck. What happens upstream, how much hydrogen you carry and how big the stack is, only matters because of what happens downstream on the DC bus.
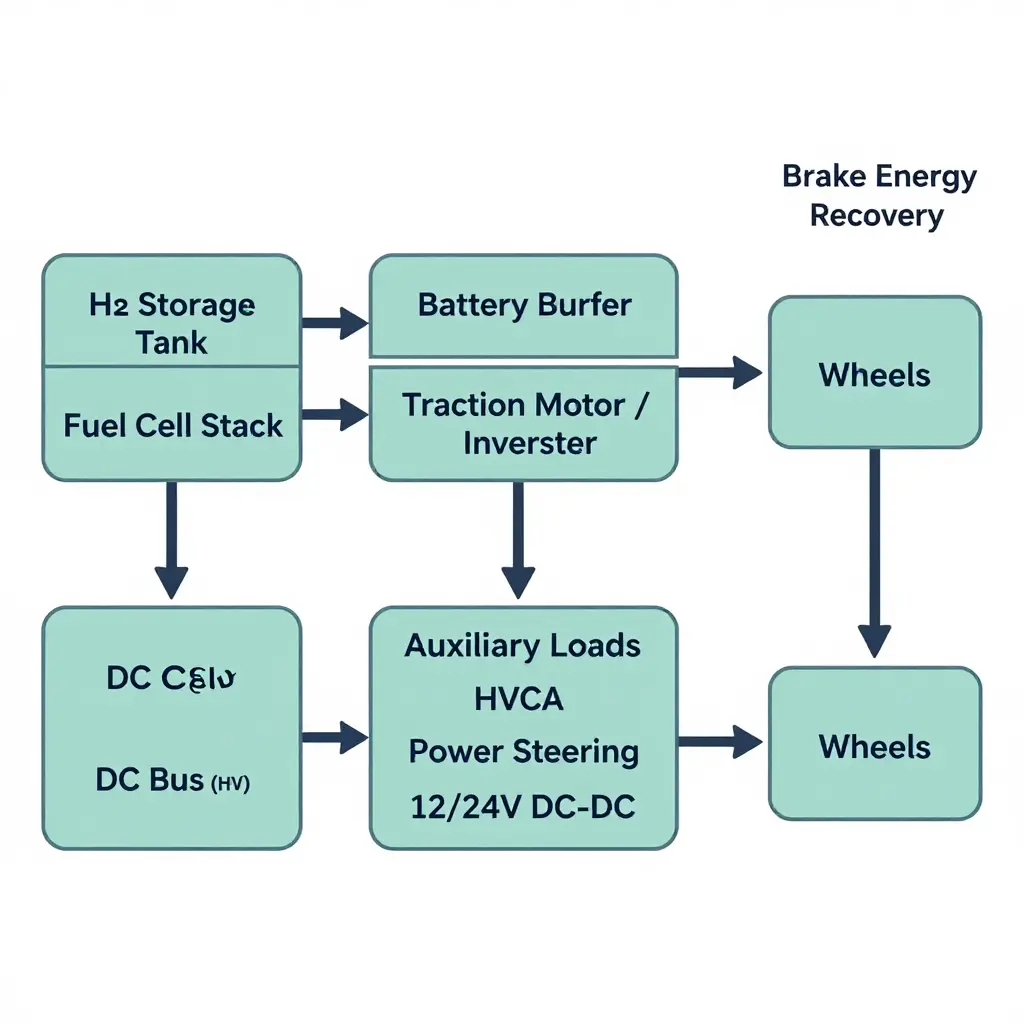
The architecture looks linear on paper. In practice it is a set of competing claims on the same bus.
Reading the diagram like an engineer
- Hydrogen storage tank to fuel cell stack. The tank sets your usable energy ceiling; the stack sets your continuous power ceiling. These are two separate sizing decisions that get conflated constantly in marketing brochures.
- Fuel cell stack to the DC bus. The stack produces DC power at a voltage that must track the bus. Stack “rated power” is measured at an optimal point on its polarization curve, not at the voltage your bus actually runs at during a grade climb.
- DC bus to traction motor and battery buffer. The bus is the arbitration layer. The battery buffer absorbs peaks the stack cannot ramp to fast enough and catches regenerative energy on descents.
- Battery buffer and traction motor to the wheels. The buffer smooths, the motor converts. The wheels do not care which source supplied the electrons, only that the torque request was met.
- Auxiliary load branches. HVAC, power steering, and low-voltage DC-DC conversion tap the same bus. On a heavy-duty tractor these parasitic loads are not rounding errors, and stacking them against route energy is where advertised range quietly disintegrates.
Why this matters for stack sizing
The diagram makes an uncomfortable point: the stack is one input among several, and it sits downstream of both the tank and the electrical architecture. Size the stack against a brochure’s advertised range and you are sizing against a number generated on a flat test cycle with minimal auxiliaries and optimistic assumptions about how much of the tank’s hydrogen is usable.
A method you can defend starts at the route, not the spec sheet:
| Sizing input | What it really represents | Common oversight |
|---|---|---|
| Route energy demand | kWh over the actual duty cycle | Ignoring grade, payload, weather |
| Usable H2 (kg) | Tank capacity minus reserve | Treating gross as usable |
| Stack continuous power | Sustained output at bus voltage | Quoting peak, not continuous |
| Buffer energy (kWh) | Peak-shaving and regen absorption | Understating grade recovery |
| Auxiliary load (kW) | Parasitic draw across the shift | Excluding HVAC and PTO |
Once you can point to each box on the schematic and give it a number from your own route, stack size stops being a marketing abstraction and becomes an engineering target. Until then, advertised range is a hypothesis, not a specification.
Accounting for Stack Derating and End-of-Life Degradation
A hydrogen fuel cell stack does not deliver its nameplate power indefinitely, or even consistently on a given day. Effective fuel cell stack sizing has to be anchored to the worst-case operating envelope, not the laboratory beginning-of-life (BOL) rating. Size a range extender against nameplate output and the truck passes validation on paper, then fails on the road once real conditions and degradation erode usable power.
Beginning-of-Life Versus End-of-Life
Proton exchange membrane (PEM) stacks lose performance through membrane thinning, catalyst dissolution, and platinum particle agglomeration. A typical heavy-duty stack is warranted to retain roughly 80-90% of BOL power at end-of-life (EOL), commonly defined as 20,000-30,000 operating hours. A 200 kW BOL stack may therefore guarantee only about 170 kW at EOL. Route energy coverage requires the stack to close the gap between battery state-of-charge depletion and the next charging opportunity, so the EOL figure, not the BOL figure, is the number that matters for sizing.
Derating Factors That Compound
Environmental and transient conditions apply multiplicative derating on top of degradation:
| Condition | Typical Power Factor |
|---|---|
| Baseline nameplate (BOL) | 1.00 |
| High altitude (reduced O2 partial pressure) | 0.85 |
| High coolant temperature (thermal limit) | 0.90 |
| Cold start (frozen stack, sub-zero) | 0.80 |
| EOL degradation | 0.90 |
| Combined worst case | ~0.55 |
These factors stack; they do not average. With altitude, heat, a cold start, and degradation all in play, a route can demand nearly twice the nameplate power the truck was quoted.
Specifying Against Worst-Case Conditions
The disciplined practice is to specify nameplate power against the compounded worst-case condition, then add a modest engineering margin. A fleet evaluating a hydrogen fuel cell range extender should ask the integrator for the EOL, altitude-derated, hot-coolant figure rather than the marketing headline. Sizing to that floor keeps route energy coverage intact across the asset’s full service life.
From Methodology to Vehicle Platforms: Integration Considerations
A stack sized against route energy only earns its savings if the surrounding vehicle package can support it. For fleet procurement teams, three integration variables decide whether the method survives daily duty cycles: battery buffer sizing, hydrogen storage capacity, and refueling dwell time. Together they shape total cost of ownership (TCO) more than the stack’s nameplate rating ever will.
Battery Buffer Sizing
The range extender is a steady-state generator, not a power reservoir. The traction pack has to absorb regenerative braking and cover transient peaks. Undersize it and the stack cycles hard and shortens its life; oversize it and you add mass that erodes payload and efficiency. The right buffer depends on grade profile, duty-cycle aggression, and how much route energy is actually recoverable.
Hydrogen Storage Capacity
Tank capacity sets the real operating range, not the advertised figure. Procurement should size storage to the longest leg plus a reserve margin, then weigh the mass penalty of every extra kilogram of H2 against the cost of a mid-route top-up. This is where hydrogen fuel cells in sustainable trucking diverge sharply from pure battery strategies.
Refueling Dwell Time
A range extender only pays off if refueling fits the existing schedule. If a hydrogen top-up adds a shift-length stop, the TCO case weakens against a depot-charged battery powertrain. Dwell time is an operational constraint to engineer in, not an afterthought.
Integration Factor Snapshot
| Integration factor | Sizing consideration | Common procurement pitfall |
|---|---|---|
| Battery buffer | Regen capture and transient peaks | Matching pack to advertised range |
| H2 storage | Longest leg plus reserve margin | Ignoring the mass penalty |
| Refueling dwell | Schedule compatibility | Assuming passenger-vehicle fill times |
The trade-offs between electric and hydrogen fuel cell architectures and their operating cost drivers should be modeled side by side before a fleet commits capital. For operators who want the method translated into hardware, EV Special Trucks offers custom configurations and full-set export solutions for new-energy special vehicles, aligning stack, buffer, and storage to actual routes rather than a marketing datasheet.
The Stack-Sizing Margin Stack-Up
Sizing a hydrogen fuel cell stack for a truck is not a matter of matching advertised range. It means building margins up from the route’s true energy demand. The diagram below shows a base power requirement compounding through successive margin layers, grade reserve, cold and hot derating, end-of-life degradation, and auxiliary load contingency, until it resolves into the specified nameplate stack power.
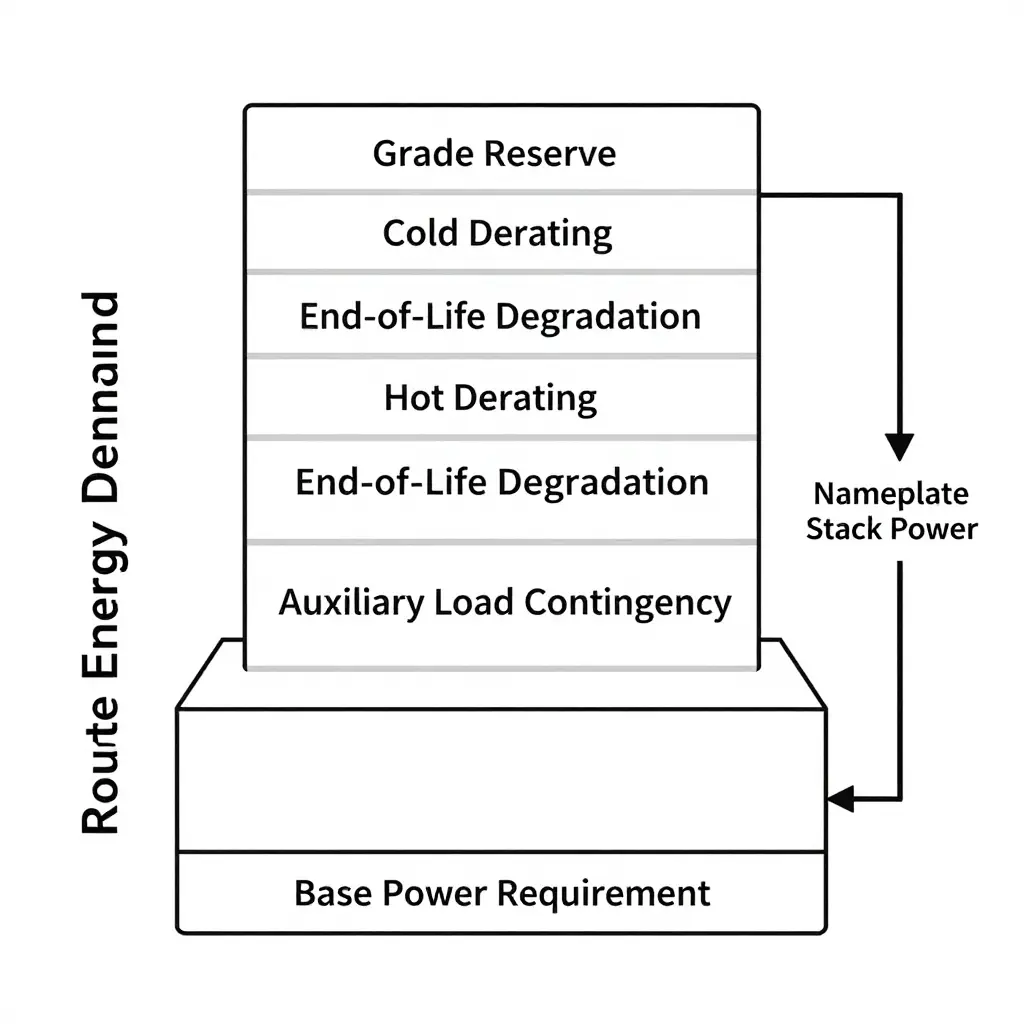
Every layer is a real engineering constraint. Stacking them in sequence is what separates a nameplate figure that survives a full duty cycle from one that only looks adequate on a spec sheet.
Frequently Asked Questions
How do I calculate route energy before specifying a fuel cell stack?
Route energy is the total wheel-energy demand over the real duty cycle. Derive it from vehicle mass, aerodynamic drag, rolling resistance, grade profile, and auxiliary loads, then divide by component efficiencies to get the combined battery-and-stack draw. Capture it through telematics logging or physics-based simulation against actual route topology, not a single averaged duty cycle. That measured or modeled budget is the foundation of stack sizing, because it sets how much energy the onboard system must supply per trip.
Why can’t advertised range size a fuel cell range extender?
Advertised range is usually measured under idealized, often lightly laden test conditions that leave out payload, auxiliary loads, and grade, so it cannot represent the true route energy of a loaded commercial truck. A range extender has to be sized against the worst credible route energy and the sustained power needed to hold speed on a grade, not a marketing figure that omits those losses. Anyone evaluating hydrogen fuel cell range extenders for heavy-duty trucking should treat advertised range as a starting point at best, never as a sizing input.
How much margin for degradation is typical?
Common practice is to size with roughly 10 to 20 percent headroom above beginning-of-life demand to absorb fuel cell and battery degradation over the service life, with a further margin reserved for cold-start derating and end-of-life power shortfall. That keeps the system able to meet route energy requirements at the end of the warranty period without oversizing the stack uneconomically.
Does a larger battery reduce stack size?
Yes. A larger battery can buffer peak demand and let the stack run nearer its efficient steady-state power, which may reduce the required stack size. The stack must still deliver the average route energy across the longest continuous high-load segment, though, so an oversized battery adds mass and cost without removing that continuous-power floor.
How do payload and grade change stack requirements?
Both raise tractive energy through added mass, higher rolling resistance, and gravitational work, which increases route energy and the continuous power the stack has to provide. Sustained or steep grades amplify the instantaneous power peak the most. Accurate stack sizing therefore has to be anchored to the actual grade profile, not flat-road averages.
Decision Guidance: Size to Route Energy, Then Validate
The argument here is simple. For a hydrogen fuel cell range extender for trucks, size the stack against measured route energy, not advertised range. Advertised range comes from favorable, often idealized conditions, and it ignores payload variation, elevation, ambient temperature, and the parasitic loads a working truck carries. Route energy measured over your real duty cycle is the work the vehicle performs trip after trip, and that is what the stack has to deliver, with headroom left for derating and degradation.
Before committing to a configuration, work through this checklist:
- Measure route energy for each representative duty cycle, using logged telemetry rather than nameplate estimates.
- Add a derating margin for high ambient temperatures, altitude, and sustained high-load operation.
- Add a degradation margin so end-of-life performance still satisfies the route requirement.
- Confirm hydrogen storage and buffer battery capacity align with the resulting energy target.
- Validate the full system across a repeatable route before scaling procurement.
Sizing to route energy with explicit derating and degradation margins holds up better than trusting advertised range. Teams building the business case can start with understanding how hydrogen fuel cells support sustainable trucking. As production volumes rise and refueling infrastructure matures, route-energy-based sizing gives fleets a repeatable way to scale hydrogen deployments, turning isolated pilot trucks into dependable zero-emission operations.