

Electric Semi Truck Dealer Handover: A Technical Acceptance Milestone
A handover at an electric semi truck dealer ends with a signature. It records custody, and that is the smallest part of what the day is for. What the fleet needs is evidence that the tractor and the charger behind it can do the work they were specified for, because anything missed in the yard costs more to fix once the truck is loaded and gone.
Two things decide whether the first route runs. The first is charger commissioning: the unit has to be energised, configured and shown to deliver rated output to that specific truck, on that site, in that site’s conditions rather than on a specification sheet. The second is battery state of charge (SOC) at acceptance, measured and written down at the moment of handover, not inferred from a dashboard estimate, a carrier’s nominal figure or a number copied forward from depot paperwork. A good result on one does not cover an unverified result on the other.
Commissioning is a working test, not an electrical inspection. It proves that the charger, its upstream protection, its connector and any site load management logic complete a full session at the expected power, that the session log can be retrieved afterwards, and that fault behaviour was watched rather than assumed. The SOC reading sets the energy budget for the first dispatch, so it belongs on the record as a measured percentage beside pack temperature and any balancing notes the dealer can supply. The full sequence is described in this walkthrough of the electric semi truck dealer acceptance process.
A first dispatch is only as good as the weaker of those two facts. Charge the truck but leave the charger unproven, and the next session is a guess. Prove the charger but release the truck at 40%, and the route plan is a guess. The handover is complete when the charger and the pack both carry a sign-off, and not before.
Why Handover Is a Technical Gate, Not Paperwork
A signature on a handover sheet settles custody. It says nothing about whether the truck can run tomorrow’s route. In electric fleets the document is often signed before anyone has demonstrated that the vehicle and the depot charger can do the work, and the cost of that gap arrives later as downtime, emergency energy or a warranty dispute. The fix is to treat handover as a gate with three layers of readiness – physical, energy and data – each with its own evidence, its own owner and its own failure mode. A dealer that collects the signature before all three are confirmed has not removed the risk; it has moved it onto the fleet’s balance sheet.
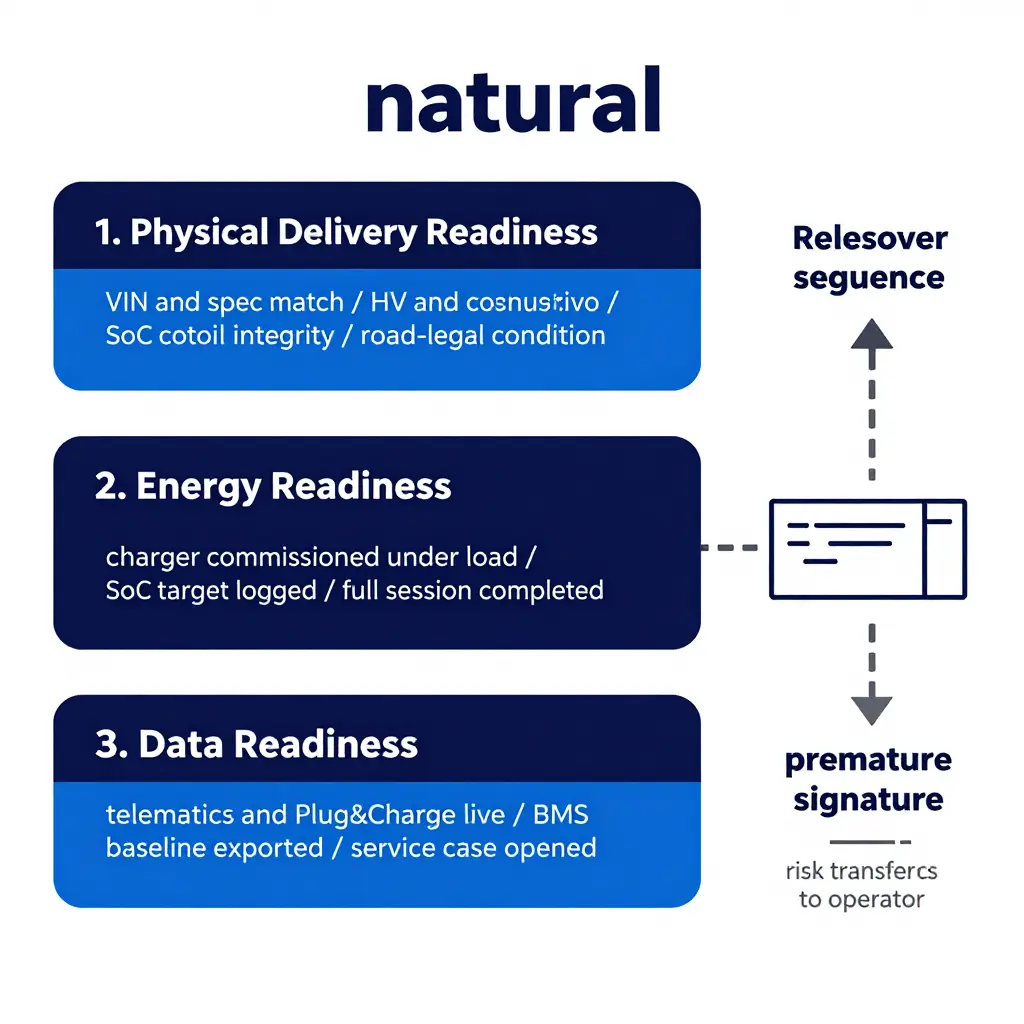
Layer 1: Physical Delivery Readiness
This layer confirms the asset exists in the configuration that was purchased and is legal and safe to operate: VIN against the order, axle and fifth-wheel ratings, payload and tare, tyres and inflation, brakes and air system, high-voltage cable routing and shielding, coolant level and loop pressure, charge port condition, body or upfit completion. Most fleets already do it reasonably well, because it is visible and familiar.
It does not prove the truck can earn. A unit can pass every physical check and still miss its first delivery, because none of those checks say anything about delivered energy, or about whether the depot can put energy back into the pack. Treating a clean inspection as a completed handover is a common structural mistake in electric adoption.
Layer 2: Energy Readiness
Energy readiness decides the first route, and it rests on two instruments: charger commissioning and SOC at handover. Commissioning means the unit is energised, firmware is checked against the truck’s expected charge curve, connector and protocol compatibility is confirmed, rated output is measured at the vehicle rather than at the cabinet display, and a full session is completed and logged end to end. A charger that switches on but derates at the plug passes a walkaround and fails a route.
SOC at handover is the stored-energy term in the same equation. Usable energy at release is usable pack capacity times SOC, less any temperature derate. The percentage is measured against the usable window, so the bottom reserve is already excluded and should not be subtracted a second time. The first route works when route demand – grade, payload, ambient temperature, HVAC or APU load included – fits inside energy at handover plus energy from in-route charging, with a margin someone can defend. Leave either input unverified and the margin is fiction.
Layer 3: Data Readiness
Data readiness makes the other two layers auditable and keeps the truck inside its warranty and service envelope: telematics provisioned, driver and dispatcher accounts assigned, charge network identifiers and Plug&Charge certificates live, OTA software baseline confirmed, BMS and battery health snapshot exported at mile zero, warranty registered, depot energy management integrated. Without a mile-zero health record, a later degradation claim turns into a negotiation instead of a measurement.
Energy planning gets its reference point here too. The mile-zero state-of-health and SOC record is what the charging cost per mile model is later checked against, and it is the only baseline that holds up if a first route underperforms.
Checked at delivery versus checked at energy-ready release
- Delivery: VIN and spec match, body and glass condition, tyres and brakes, coolant and fluid levels, keys, registration documents, odometer at zero.
- Energy-ready release: charger commissioned and output verified under load, SOC target met and logged, one complete charging session on record, route energy model reconciled against starting energy.
- Delivery: driver walkaround acknowledged.
- Energy-ready release: telematics live, Plug&Charge certificate active, charging account mapped to that truck, service case open, BMS baseline exported.
What a Premature Signature Actually Transfers
Sign before the three layers are confirmed and the dealer’s commissioning obligation turns into an after-sales conversation, while the operator absorbs the mechanics of a failed first route. Those costs do not scale neatly. First comes fixed carrying cost on a capitalised asset that is insured and depreciating while producing no revenue miles. Second comes emergency energy – recovery charging, mobile power or a tow – which is almost certainly the most expensive kilowatt-hour a fleet buys, and it is bought under the least negotiable conditions.
Third is schedule loss, usually the largest item. Route designs carry a buffer; a failed first route eats it and pushes the shortfall into customer service, spot replacement capacity and driver hours that no longer match the plan. Fourth is accounting ambiguity: failures after signature tend to be logged as operational defects rather than incomplete commissioning, which weakens the operator’s position on warranty claims, especially where low-SOC storage or a poorly commissioned charger is later named as the cause. The practical control is to buy from a dealer that documents all three layers before release. Buyers comparing suppliers can weigh what a properly structured electric semi truck dealer engagement should include before the first load is dispatched.

The handover ends when the charger proves it can put energy into that truck, on that site, on day one – not when the keys change hands. The checklist below runs through fourteen numbered checkpoints, each with a pass criterion and one blunt question attached: should a failure here stop the first route? Fleet buyers working through an electric semi truck dealer handover can sign it off line by line instead of taking a verbal walkthrough.
The 14-Point Charger Commissioning Checklist
1. Utility service and transformer capacity confirmed
Check the service entrance rating, transformer nameplate kVA and measured spare capacity against the charger’s nameplate input, ideally during a peak-demand window. A 350 kW dispenser that browns out a shared 500 kVA transformer at 06:00 cancels a route; it is not an inconvenience. Put the numbers beside the utility’s confirmed interconnect and any queue restrictions. Blocks route release: yes – if available capacity sits below the commissioning load, the truck stays put.
2. Protection settings and breaker coordination verified
Confirm that breaker trip curves, ground-fault settings and the charger’s internal protection are coordinated with upstream devices, so a single fault isolates the smallest possible section of the yard. Poor coordination gives you nuisance trips across the depot, or an uncleared fault that damages modules. Record every setting value, not a tick in a box. Blocks route release: yes.
3. Firmware and configuration baseline captured
Export and archive the firmware version, serial numbers, network parameters, power module count and the full configuration file before the first session. This is the file you compare against in six months, when an over-the-air update has quietly changed behaviour or a warranty claim needs evidence. Store it with the truck’s delivery file. Blocks route release: no, but the export has to exist before the handover is signed.
4. Connector and cable condition checked, with a connector temperature test
Inspect pins for arcing or discoloration, the cable jacket for abrasion and the latch for a positive lock, then run a load and measure connector temperature rise with a thermal camera or embedded sensors. A warm pin at 70% load becomes a melted connector at full output on a hot afternoon. Compare the rise against the OEM limit. Blocks route release: yes, where the rise exceeds specification or a pin shows damage.
5. Earth continuity and insulation resistance proven
Measure insulation resistance on the AC and DC sides and confirm earth continuity from charger chassis to the site grounding grid, with the values written down. This is the check that protects the driver standing in the rain holding a connector, and the one most often skipped when the schedule slips. One poor bond compromises every session that follows. Blocks route release: yes, always.
6. Power quality measured and logged
Capture voltage, frequency, total harmonic distortion, power factor and phase imbalance across a representative session, not at idle. Poor power quality stresses rectifiers and ripples back into refrigeration, dock equipment and office loads. If the site runs on a weak feeder or shares a transformer with welding equipment, measure twice. Blocks route release: conditional – investigate before release if THD or imbalance exceeds the charger OEM’s stated limits.
7. Load management and demand-response setpoints configured
Verify the site controller’s maximum import limit, per-charger allocation, priority rules and any utility demand-response or time-of-use schedule. Without them, one truck charging at peak can spike demand charges or trip the main breaker. Test the cap by commanding a lower setpoint and watching delivered power fall. Blocks route release: yes, if the site-level limit is unset or untested.
8. Session authentication, billing, and telemetry handshake tested end to end
Run the whole chain: driver or depot authentication, authorisation response time, meter start and stop, tariff application and the outbound telemetry feed into the fleet portal. Silent chargers and misapplied tariffs are found here, not at month-end reconciliation. Confirm that a failed authentication produces a clear, actionable message on the display. Blocks route release: yes for authentication and metering; telemetry can be fixed within 72 hours on a written plan.
9. Liquid-cooling or thermal management verified (where applicable)
For liquid-cooled cables and power modules, check coolant level, pump operation, flow and pressure readings, leak evidence and radiator airflow clearance. A derating cable on a 40°C day turns a 90-minute opportunity charge into a three-hour dwell. Log inlet and outlet temperatures under load. Blocks route release: yes, on any cooling fault, leak or unexplained derating.
10. Charge curve profile matched to the truck’s battery management system
Confirm the charger’s voltage window, maximum current and charge curve align with what the truck’s BMS actually requests, particularly the taper point above 80% SOC. A mismatched profile either stretches session time or pushes current the pack will refuse, and either one costs the site the driver’s trust. Cross-check the OEM’s approved profile list. Blocks route release: yes, on any mismatch between configured and BMS-requested limits.
11. Live charge session test at low, mid, and high state of charge
Run real sessions starting near 20%, 50% and 85% SOC, logging kW delivered, session duration, energy metered and any fault codes. The high-SOC test is where taper behaviour and thermal management show themselves, and where a truck with an unbalanced pack reveals its true charge time. Compare the results with the OEM curve. Blocks route release: yes – no truck leaves without one completed, logged high-SOC session.
12. Emergency stop and safety interlock test
Trip the E-stop, open the door interlock, simulate loss of communication, and confirm contactor opening, stored-energy discharge and correct fault messaging. Drivers and first responders rely on these devices doing exactly one thing, every time. Test with the cable energised and the truck’s contactors open, then repeat during a live session. Blocks route release: yes.
13. Ambient temperature derating thresholds documented
Record the charger’s derating curve, the pack’s temperature limits and the site’s shade and airflow conditions, then compare them with the forecast for the first route’s departure window. Undocumented derating is how fleets get surprised on the first cold morning or the first heatwave. Put the numbers in the handover pack with a plain-language summary for dispatch. Blocks route release: no, but the figures have to be written down and shared with operations.
14. As-built labeling and single-line diagram handed over
Verify that every disconnect, breaker, charger and junction is labelled to match an as-built single-line diagram, then hand over the diagram, protection settings, commissioning report and firmware baseline as one set. The technician on call at 02:00 needs to know which breaker to open without guessing. Include a photo set of each labelled panel. Blocks route release: no, but incomplete documentation delays warranty support and is a defect to close within two weeks.
Blocking versus non-blocking: quick reference
| # | Checkpoint | Blocks route release? |
|---|---|---|
| 1 | Utility and transformer capacity | Yes |
| 2 | Protection settings and coordination | Yes |
| 3 | Firmware and config baseline | No (must be on file) |
| 4 | Connector and cable condition, temperature | Yes if over spec |
| 5 | Earth and insulation resistance | Yes, always |
| 6 | Power quality | Conditional |
| 7 | Load management and demand response | Yes if unset |
| 8 | Authentication, billing, telemetry | Yes for auth and metering |
| 9 | Liquid cooling and thermal management | Yes on fault or leak |
| 10 | Charge curve matched to BMS | Yes on mismatch |
| 11 | Live session at low, mid, high SOC | Yes |
| 12 | Emergency stop and interlocks | Yes |
| 13 | Derating thresholds documented | No (document it) |
| 14 | As-built labels and single-line diagram | No (close within 2 weeks) |
Sign each line, attach the raw measurement files and hand the pack to the fleet’s operations lead. A truck that leaves without a logged high-SOC session is a promise nobody has tested.
The Handover Gate Workflow: Five Checkpoints, One Sequence
A handover runs as a chain of gates, and each one has to close before the next opens. That is why a missing commissioning report can hold up a truck that is otherwise perfectly road-ready. The table below reduces the process to its five stages and shows what each stage unlocks and what it blocks.
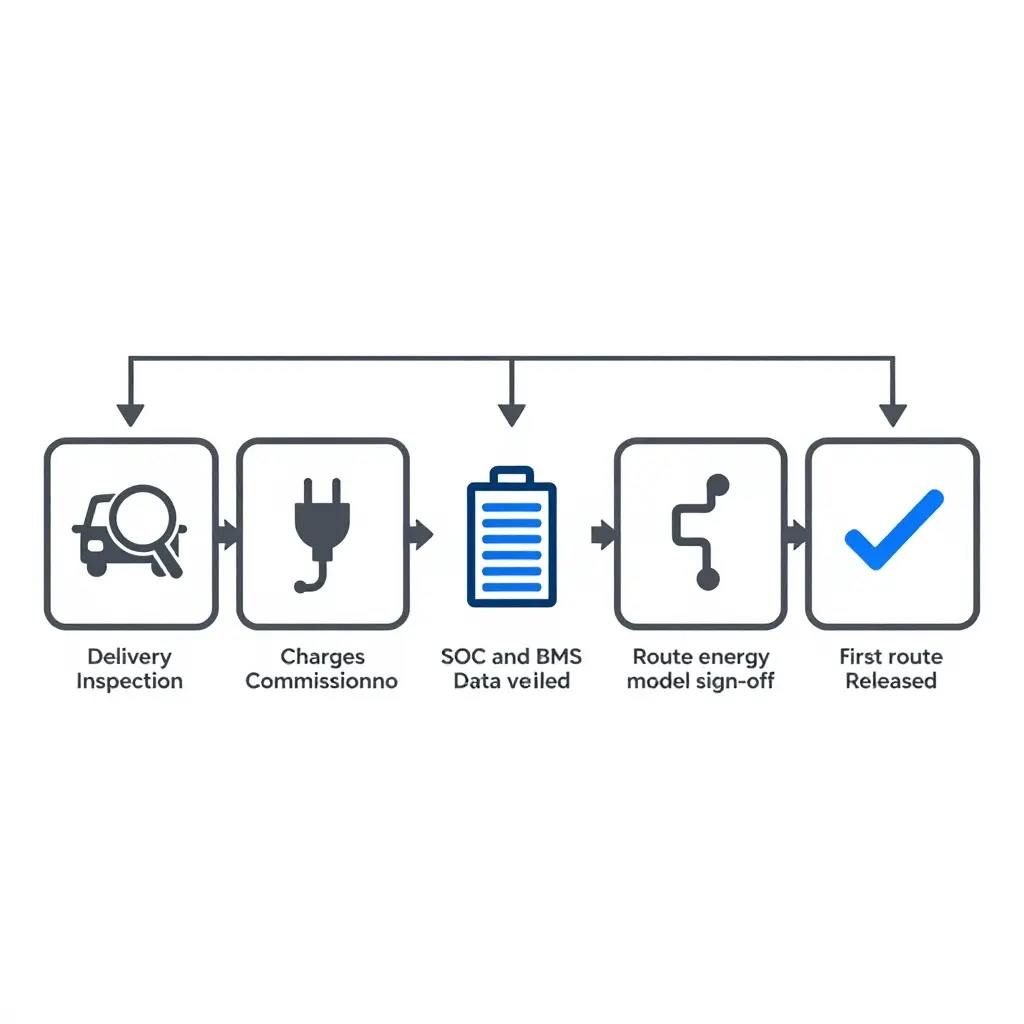
The gate order
| Stage | What Unlocks It | What It Blocks |
|---|---|---|
| Delivery inspection | Vehicle arrives, cosmetic and mechanical walkaround complete | Everything downstream |
| Charger commissioning verified | Charger energised, power output and connector handshake confirmed | Charging validation and SOC targets |
| SOC and BMS data verified | Pack state of charge and BMS fault logs read out and accepted | Route energy model calibration |
| Route energy model signed off | Consumption figures reconciled against the customer’s real duty cycle | First route release |
| First route released | All four prior gates cleared and documented | Nothing – this is the exit gate |
Why the order cannot be shuffled
The arrows in that diagram point one way because the work is cumulative. A charger that has not been commissioned makes a verified SOC reading meaningless, since nothing confirms the pack will reach its target overnight. A route model built without confirmed battery data is guesswork with a spreadsheet around it. Treat each block as a locked door and the handover becomes auditable instead of anecdotal.
Teams that formalise the sequence tend to report fewer first-week surprises, because every assumption the first route rests on has been written down and checked by someone with a name. When you choose a supplier, look for one that can describe these gates without being prompted; that is a fair sign of process maturity. The criteria are set out in this guide to working with an electric semi truck dealer that treats handover as an engineering sign-off rather than a delivery photo.
Interpreting Commissioning Acceptance Criteria
Commissioning results are worth what you make of them. A completed test sheet is raw material; an interpreted one is a release decision. The question to answer is narrow: is this charger fit to support the first revenue route, and if not, what exactly is in the way?
Three outcomes: pass, conditional pass, hold
A pass means every measured value sits inside its tolerance band, every required test is recorded and nothing is left open against the charger. It is a statement about evidence, not an impression that the equipment “looks fine.”
A conditional pass means the charger is safe and functional but one or more values sit in an extended band that needs documented follow-up. It is not a soft pass. Name the owner, the deadline and the retest method, and keep the item visible in the handover file instead of buried in a notes column.
A hold means a result is outside tolerance, missing or unverifiable, and the affected function stays locked out until the item is corrected and retested. Holds are what stop optimism from turning into operational risk.
Hold points that must clear before the first route is released
A hold point is a defined checkpoint where release is blocked until the specified evidence exists and is signed off. For a heavy-duty charging installation they usually include:
- Protective earthing and insulation resistance verified at the stated test voltage.
- Protection settings and emergency stop function confirmed as tested, not assumed.
- Communication between charger, vehicle and back office proven with a recorded session.
- Delivered power confirmed at the target SOC, not only at a low SOC.
- Connector temperature rise measured at sustained rated current.
- Session success rate established across a defined number of consecutive attempts, including start, stop and restart.
Why measured values beat checkboxes
A checkbox records that a test happened. A measured value records what the equipment did. The difference matters because charging faults rarely fail outright on day one. They drift.
Insulation resistance can pass at delivery and then decay with moisture ingress. Connector temperature rise is the first sign of contact resistance building at the interface. Session success rate exposes communication and authorisation faults that one lucky session hides. Delivered power at target SOC shows whether the charger holds output while the pack tapers, which is exactly where route timing is won or lost. Captured at a known point in time, these become the baseline later maintenance is measured against. Fleets that treat the electric semi truck dealer handover as an evidence pack rather than a signature sheet keep that baseline intact.
Recording tolerances in the handover file
A tolerance entry carries the acceptable range, the measured value, the unit, the instrument and the test conditions side by side, so a later reader can judge the result without repeating the test. A value without a tolerance is an opinion; a tolerance without conditions is a guess.
| Measurement | Acceptance basis | What the record must show |
|---|---|---|
| Insulation resistance | Manufacturer minimum at stated test voltage | Measured value, test voltage, ambient conditions |
| Connector temperature rise | Within OEM limit at sustained rated current | Measured rise, current held, duration |
| Session success rate | Defined pass ratio over consecutive attempts | Attempts run, failures, error codes |
| Delivered power at target SOC | Within stated band of rated output at that SOC | Power measured, SOC at measurement, duration |
Two habits keep a commissioning record usable. Note whether a value passed mid-band or scraped the edge, because edge values move first. Keep the hold-point sign-offs in the same document as the readings, so the release decision and the data behind it cannot be separated.
The commissioning record is what a fleet manager reaches for when a fault appears at 2 a.m. on the first run. Use the matrix below to confirm every charger subsystem was proven rather than merely installed, before the electric semi truck dealer releases the tractor for revenue service.
Charger Commissioning Verification Matrix for Electric Semi Truck Handover
| Verification Item | Acceptance Criterion | Tolerance Recorded | Sign-off Owner | Blocks first route? |
|---|---|---|---|---|
| Utility service capacity | Measured capacity >= site design demand + 10% headroom | Actual kVA vs design kVA | Site electrical contractor | Yes |
| Protection coordination | Selective trip coordination verified to main breaker | Relay settings, trip times | HV electrical engineer | Yes |
| Firmware baseline | All units on approved release, signed version manifest | Version hash per unit | Commissioning engineer | No (must be on file) |
| Connector condition | No arcing, pin gauge pass, latch and seal intact | Pin resistance in mOhm | Field technician | Yes if over spec |
| Insulation resistance | >= 1 MOhm at 500 V DC, de-energised cable test | Measured MOhm per cable | Field technician | Yes |
| Power quality | THD < 5%, PF > 0.95 at full load | THD %, PF, voltage imbalance | Power quality analyst | Conditional |
| Load management setpoints | Site cap = contracted demand, port priority mapped | Setpoint kW, priority order | EMS integrator | Yes if unset |
| Authentication and telemetry | ISO 15118 handshake, backend heartbeat < 60 s | Latency ms, heartbeat log | Network / IT lead | Yes for auth and metering |
| Thermal management | Coolant flow and delta-T in spec under 30-min load | Delta-T C, coolant pressure | OEM service technician | Yes on fault or leak |
| Charge curve profile | Matches OEM BMS table from 10% to 80% SOC | kW at each SOC breakpoint | Commissioning engineer | Yes on mismatch |
| Live session at multiple SOC levels | Full session at 20 / 50 / 85% SOC, zero faults | Session log, fault count | Fleet operations rep | Yes |
| Safety interlocks | E-stop, ground fault, cover interlocks trip < 100 ms | Trip time in ms | Site safety officer | Yes |
| Derating thresholds | Derate triggers at spec temperature, recovery verified | Trigger temp C, recovery time | Commissioning engineer | No |
| Documentation handover | As-builts, O&M manuals, warranty registry, training log | Document set count, training hours | Dealer handover specialist | No |
Treat the matrix as a release gate rather than paperwork. Every row marked Yes needs a signature before the tractor leaves the yard; conditional rows go onto a 30-day closeout list with a named owner. Hold the first route until the blocking items clear, then re-verify derating and firmware after the first 500 km. A signed matrix is the evidence you want if the warranty is ever disputed.
Battery State of Charge (SOC) Fundamentals: The Number You Hand Over
Every handover conversation arrives at the same question: how far will this truck go on the energy it has right now? The honest answer is that SOC is not a fuel gauge, and the percentage on the dash is not a range. It is a live estimate of what sits inside a usable window, produced by a battery management system (BMS) reasoning about capacity, age, temperature and load. Knowing what sits behind the number is the difference between a handover that works and a first route that ends on a recovery truck.
Nominal Versus Usable Capacity
The nameplate figure is gross energy: cell capacity summed at a defined temperature and rate. The truck never gets all of it. A reserve sits at the bottom to protect the cells from deep discharge, a buffer at the top leaves headroom for regen and slows degradation, and the BMS opens the contactors before either limit is stressed.
| Item | Nominal (gross) figure | What the truck actually delivers |
|---|---|---|
| Pack energy | Sum of cell capacity, e.g. 500 kWh class | Usable window only, e.g. 450 kWh |
| SOC scaling | Often quoted against gross | Usually mapped to the usable window |
| End of discharge | Cell cutoff voltage | Reserve buffer above cutoff |
| End of charge | 100% displayed | Top buffer plus taper-limited energy |
| Ageing reserve | Not represented | Held back to limit warranty exposure |
Two trucks with identical nameplate capacity can therefore hand over different usable energy. Ask for the usable figure, not the marketing one.
SOC Versus SOH: A Healthy Pack Can Still Report an Unreliable Battery State of Charge (SOC)
State of health (SOH) describes how much capacity and resistance the pack has left relative to beginning of life. SOC describes where the truck sits inside that capacity right now. They come from overlapping data but behave very differently. SOH is a slow, heavily filtered average that barely moves in a week. SOC is a point-in-time value that inherits every error accumulated since the last clean calibration.
That is why a pack reading 97% SOH can still show a SOC that wanders. A truck on short shuttle cycles never rests long enough for an open-circuit-voltage reference, never charges to full and never exercises the ends of the window, so the estimator has nothing to correct itself against. A slow shunt offset integrates into a bias that shows up as a drifting percentage long before any capacity loss appears. Regular battery health inspection routines and a full charge at handover give the BMS an anchor.
How the BMS Estimates State of Charge and Where Error Enters
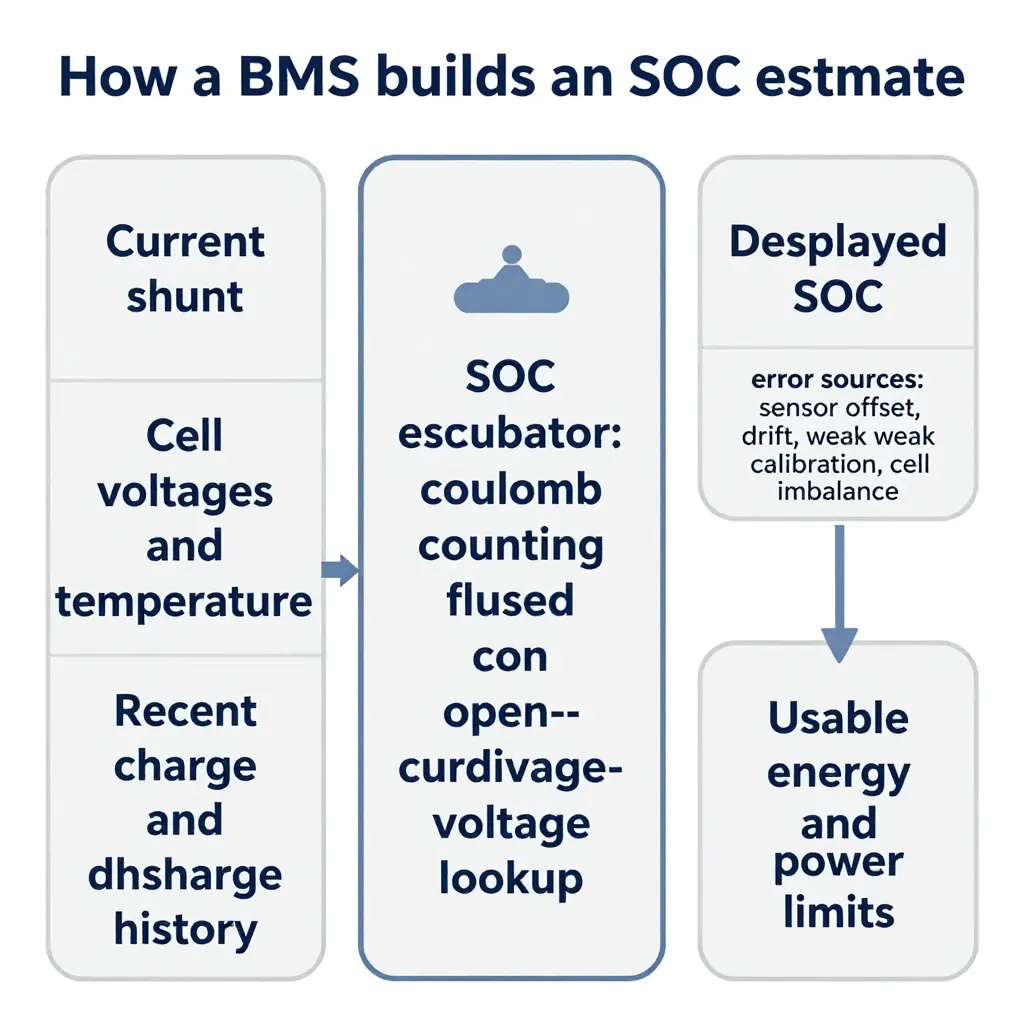
Most BMS platforms fuse two methods. Coulomb counting integrates current in and out; it is accurate over short intervals and drifts without a reference. A voltage-based lookup corrects the drift, but only when the pack is at rest and only where the chemistry’s voltage curve is steep enough to be useful. Model-based filtering layers the two together with temperature compensation and capacity learning.
Error enters through a short list of well-understood paths: current-sensor offset and gain, long periods without a full-charge anchor, cell-to-cell imbalance that makes minimum and average cell SOC diverge, temperature gradients across a large truck pack, severe voltage sag under load, and display logic that smooths or clamps the percentage for driver comfort. None of these are faults. They are the normal cost of estimating an invisible quantity.
Cell Balancing and Temperature Effects on Usable Energy
Passive balancing bleeds charge from the highest cells, usually while the pack sits at a high SOC; active balancing moves energy between cells. Either way, balancing needs time at the top of the window. A truck that lives between 40% and 70% SOC never gives the system that time, imbalance grows, and the weakest cell reaches cutoff first, ending the discharge early for the whole pack.
Temperature cuts both ways. Cold slows ion mobility, raises internal resistance, forces charge and regen limits and removes a measurable slice of available energy. Heat drives thermal derating and makes the cooling system work harder, pulling energy from the very pack it is protecting. Factors that push usable energy below the nominal figure:
- Top and bottom buffers the traction inverter never sees
- Low-temperature charge and regen limits, and high-temperature power derating
- Cell-to-cell imbalance that ends discharge at the weakest cell
- HVAC, cab climate, APU, refrigeration and 12V DC-DC loads drawn from the same pack
- Capacity fade and resistance growth with age
- Duty-cycle severity: grade, GVW, sustained highway speed and hard starts
Charge Taper at High SOC and the Displayed-Versus-Usable Gap
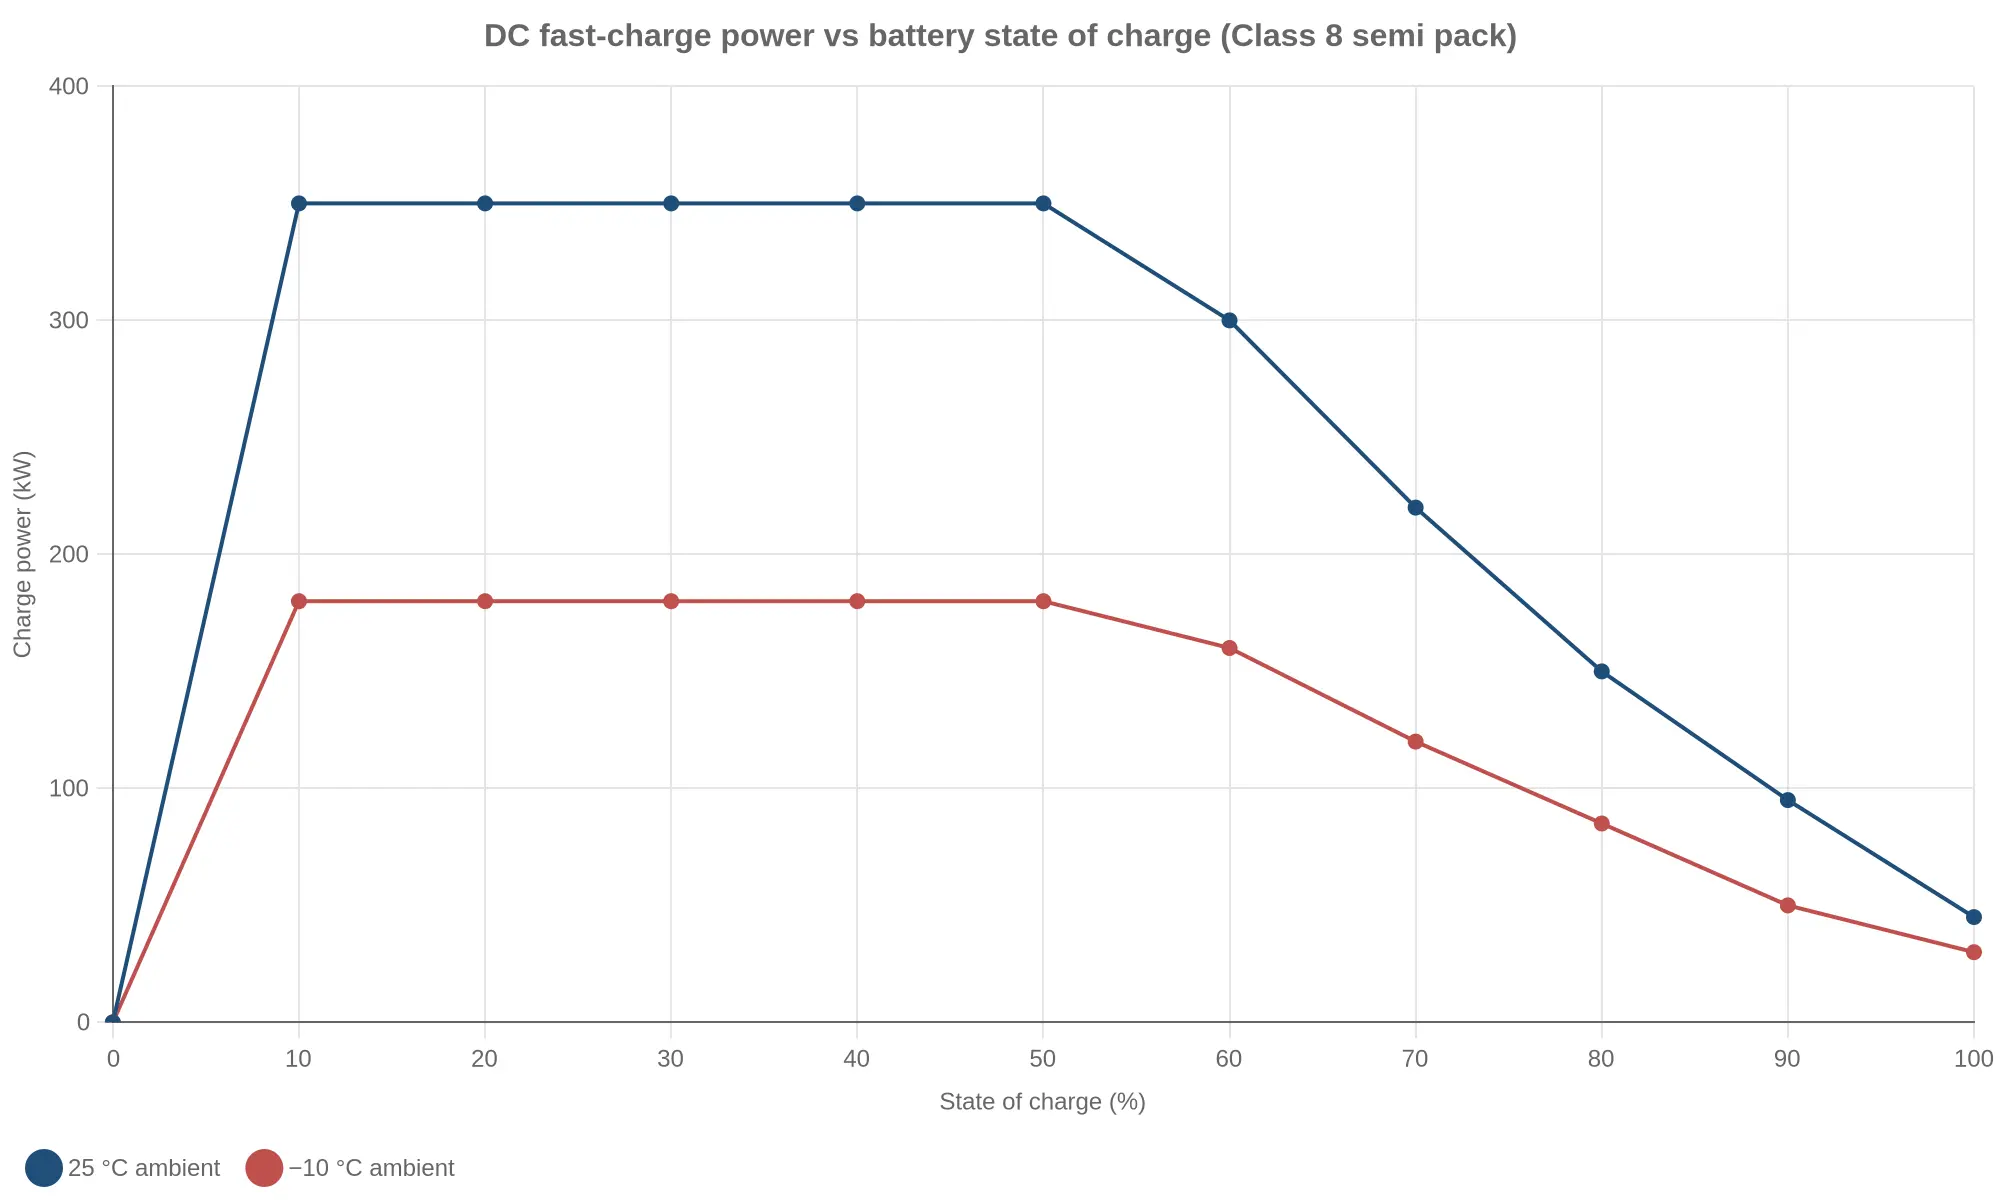
Above roughly 70% SOC, charge power falls away as the pack approaches its voltage ceiling and plating risk rises. The last stretch often takes as long as the first 60%, and cold ambient temperature lowers the whole curve. That changes the departure target: charge to 100% only when the first leg genuinely needs it, and plan around 80-90% when it does not. The same curve sets when the truck is actually ready, and it drives what a charge session actually costs as much as it drives timing.
The gap fleets miss is the one between displayed SOC and traction energy. Displayed SOC maps to a usable window, not to what the inverter can spend. A 500 kWh-class pack with a 450 kWh window at 88% displayed holds about 396 kWh. Four hours of cab climate at 6 kW takes roughly 24 kWh, auxiliary loads at 1.5 kW take about 6 kWh, and the inverter may see around 366 kWh before any derating or grade penalty. Plan the first route against that figure, and check the figure against a measured session rather than a brochure.
Departure SOC, Not the Brochure, Sets the First Route
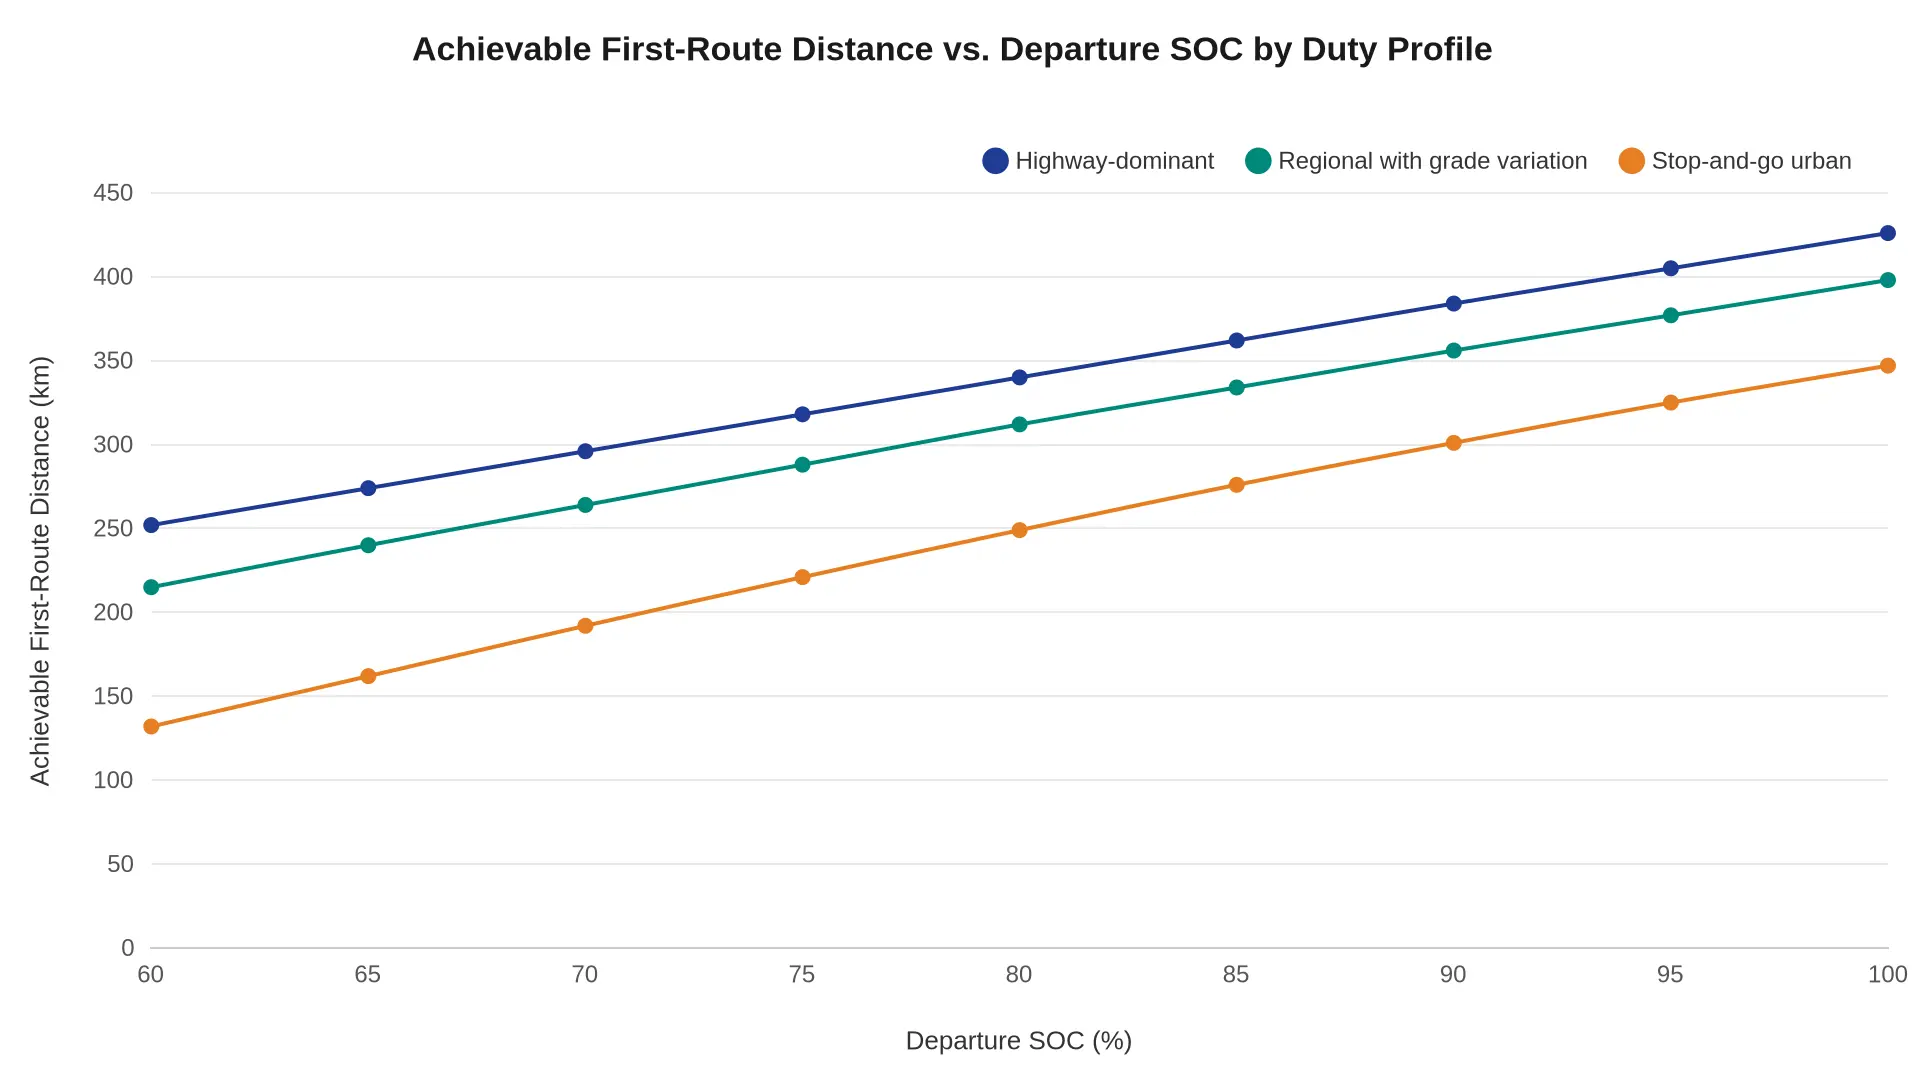
The spec sheet range is where a lot of handover conversations start. It makes a decent headline and a poor dispatch plan. What decides whether a tractor completes its first revenue run is the SOC it leaves the yard with, against the duty profile of that particular route. The chart plots achievable first-route distance against departure SOC for three generic profiles. All three rise with SOC, and the spread between them widens as SOC falls, because energy overheads, thermal management and derate margins bite hardest when the pack is not full.
What the curves show
| Departure SOC (%) | Highway-dominant (km) | Regional with grade variation (km) | Stop-and-go urban (km) |
|---|---|---|---|
| 60 | 252 | 215 | 132 |
| 70 | 296 | 264 | 192 |
| 80 | 340 | 312 | 249 |
| 90 | 384 | 356 | 301 |
| 100 | 426 | 398 | 347 |
Three things matter at delivery.
- 60% departure is not 60% of a trip. At 60% SOC the highway profile still covers about 252 km, while the urban profile manages about 132 km – roughly a third of what the same truck does on highway at a full charge. Same truck, same battery, two different routes.
- The spread widens as SOC falls. Highway and urban are about 120 km apart at 60% SOC and about 79 km apart at 100%. Auxiliary loads, cab conditioning, repeated launches and low-SOC derate all take a larger share of a smaller budget.
- Grade variation sits in the middle. A regional route with sustained climbs erodes distance faster than flat highway running but far slower than dense stop-and-go work, which is why route matching beats a single “range” figure every time.
What Belongs in the Delivery Record
A disciplined electric semi truck dealer handover finishes with two facts written down: the charger has been commissioned and load-tested, and the tractor leaves above an agreed SOC floor – typically 90% or higher for a first long run, or a documented lower target when the first route is short and depot charging is proven. Set the first route against the curve for its actual profile rather than the brochure number, and the first week of operations stays predictable.
Setting a Minimum Departure SOC Policy for the First Route
A handover standard is only as strong as the number it produces. Before an electric semi tractor leaves the dealer yard, the dealer specialist and the fleet operator agree on one figure: the minimum departure SOC present in the pack at dispatch. Written as policy rather than judgement, that figure becomes repeatable, auditable and independent of whoever holds the keys that morning. It also survives staff turnover, seasonal swings, and the temptation to shave a few points to make a dock appointment.
Call it a range estimate and drivers will treat it as one, which is how the policy loses its authority. Treat it as a dispatch gate instead: the lowest SOC at which a tractor may be released onto the route once every foreseeable load has already been paid for out of the pack.
Stacking the Reserve Layers Into a Minimum Departure Battery State of Charge
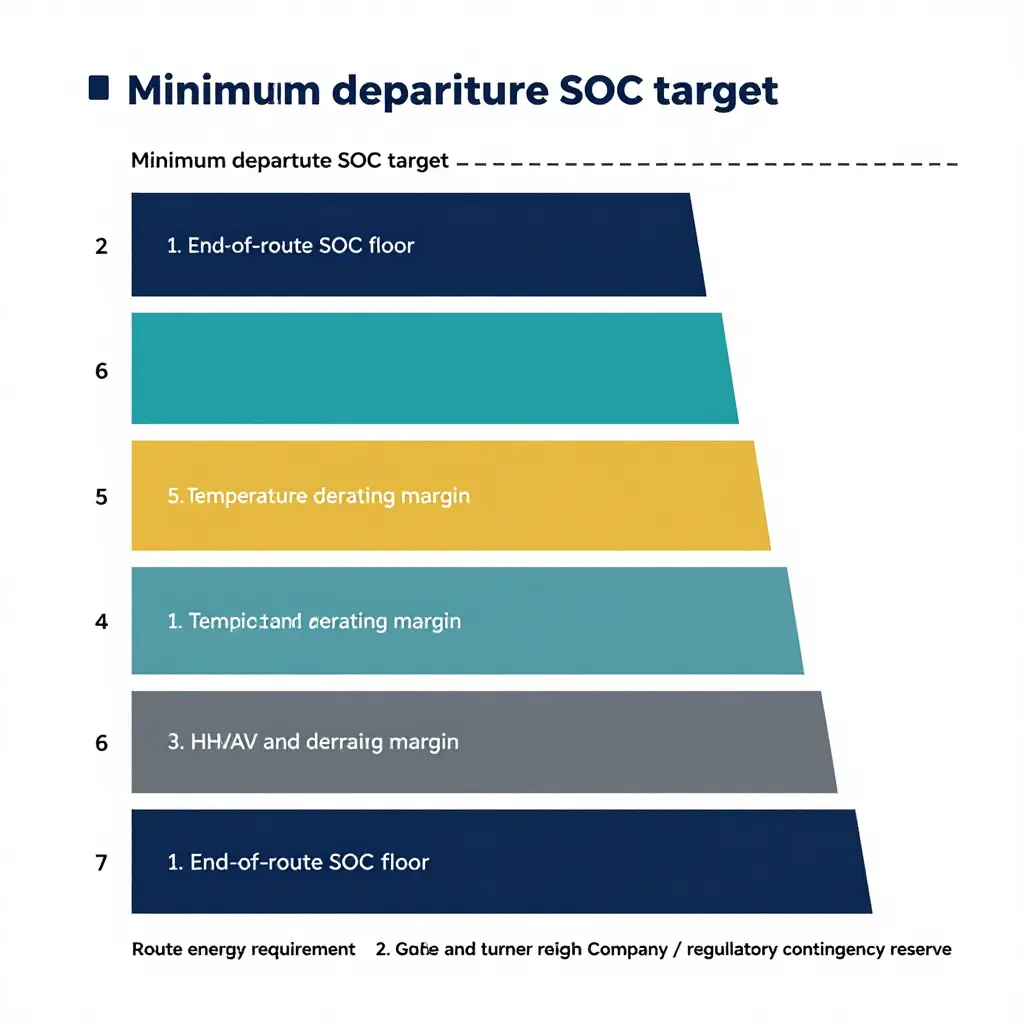
Build the target from the bottom up. Each layer covers a distinct physical or commercial exposure, and each is applied in a set order so that nothing is counted twice and nothing is quietly dropped.
Route energy requirement. The baseline, carrying no margin. It is the assigned tractor’s measured consumption in kWh per kilometre at the payload class the route is contracted to carry, multiplied by route distance. Use the truck’s own logged history; brochure range is not a valid input for a policy that carries commercial risk.
Grade and terrain margin. A percentage uplift covering elevation gain, sustained grades and the difference between assumed and realised regenerative recovery. Take the uplift from the corridor’s grade profile, not from a national default.
HVAC and auxiliary load margin. A separate percentage covering cab climate control, engine-off hotel loads and body-driven demand such as liftgates, pumps or refrigeration. These loads run independently of gradient, so they are added rather than folded into the terrain margin. Thermal-management behaviour sits here too, which is why an honest figure for auxiliary demand matters more than a generous one.
Traffic and detour margin. A percentage covering congestion, known construction diversions and weight- or height-restricted rerouting. Tie it to the corridor’s actual diversion history, or it becomes an arbitrary cushion nobody can defend.
Temperature derating margin. A percentage taken from the OEM thermal and charging table for the forecast ambient range at departure and during the shift. Cold ambient reduces usable energy and lowers charge acceptance; warm ambient drives cooling loads. This layer is derived, not estimated by feel.
End-of-route SOC floor. The first absolute layer. Expressed in percentage points rather than as a multiplier, it protects the next shift or the next charging window by ensuring the pack arrives above whatever minimum the receiving site needs to start a session reliably.
Company or regulatory contingency reserve. The second absolute layer, held back for carrier operating policy, shipper contract terms or a regulatory obligation. It goes on last, and it is the first thing an auditor asks about.
The stacking rule is simple: layers one to five compound onto the energy baseline as ratios, the result is converted to a percentage of usable capacity, and layers six and seven are added as absolute points on top.
| Layer | Applied as | Owner |
|---|---|---|
| Route energy requirement | Baseline (kWh) | Fleet operations |
| Grade and terrain margin | Percentage uplift | Fleet operations |
| HVAC and auxiliary load margin | Percentage uplift | Fleet operations |
| Traffic and detour margin | Percentage uplift | Fleet operations |
| Temperature derating margin | Percentage uplift | OEM data, applied by dealer |
| End-of-route SOC floor | Absolute points | Charging / shift planning |
| Contingency reserve | Absolute points | Compliance or carrier policy |
Policy Rules for the Handover Standard
A fleet manager can lift these rules straight into a handover standard. Each one can be verified at dispatch.
- The minimum departure SOC is stated as a single whole percentage and recorded in the handover document before the tractor is released.
- Route energy requirement comes from the assigned tractor’s logged kWh per kilometre at contracted payload, never from published range.
- Grade and terrain margin is a fixed percentage per corridor class, with the grade source and revision date referenced beside it.
- HVAC and auxiliary margin is applied separately and itemises every body-driven load expected on the route.
- Traffic and detour margin is set from documented diversion history for the corridor and reviewed whenever routing changes.
- Temperature derating margin comes from the OEM thermal table for the forecast ambient range and is re-entered when the seasonal band changes.
- The end-of-route SOC floor is written in absolute percentage points and must meet the minimum charge acceptance of the receiving site.
- Any dispatch below the agreed target needs written sign-off from the named contingency reserve owner, recorded against the trip.
Translating the Battery State of Charge Policy Into an Agreed Target
Once the layers are defined, the policy is a short mechanical calculation: run the seven layers against the specific first route and the output is one departure SOC target. That target and the inputs behind it go into the handover document and are initialled by the dealer representative and the fleet operator. The record should carry the route energy baseline source, the ambient forecast window, the payload class, the corridor grade class and the date of the OEM derating table referenced.
It should also name the re-baseline triggers, because a target that never moves will eventually be ignored. A seasonal band change, a route-distance change, a tractor substitution or a completed commissioning test all justify recomputing the number by the same method. Handled this way, the minimum departure SOC stops being a negotiating position and becomes an operating parameter both sides stand behind. Operators reviewing dealer terms can explore the electric semi truck dealer resource library for supporting handover guidance.
Why the dashboard SOC and the usable SOC are two different numbers
At handover, a fully charged pack rarely gives its full nameplate energy on the first route. A stack of margins sits between what the battery holds and what the driver can spend. The diagram shows that stack from top to bottom, each band peeled off before the truck turns a wheel.
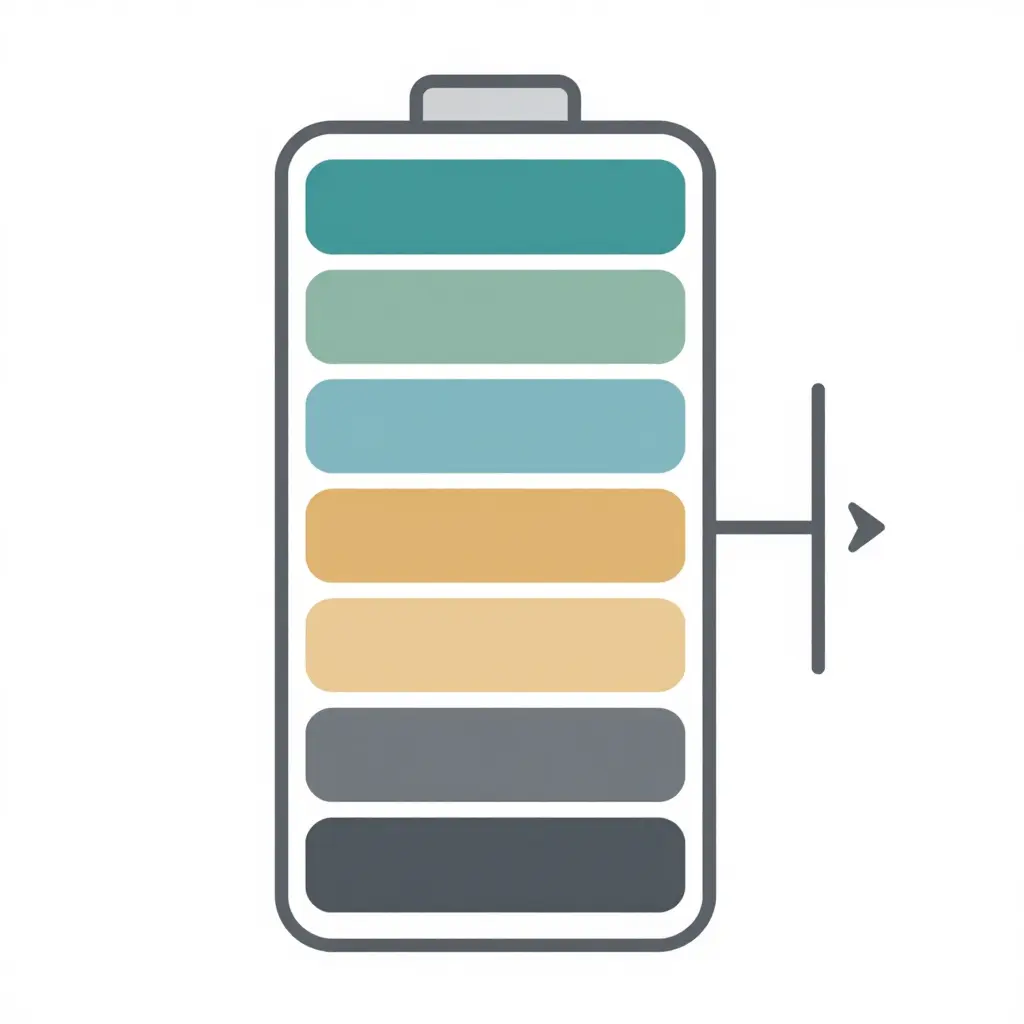
Read it top-down. Route energy is the only band that does real work on the first leg. Beneath it sit the terrain margin, the climate and auxiliary margin, the traffic margin, the temperature derating margin, the end-of-route floor the pack must never breach, and the contingency reserve kept for the unexpected detour or the charger that fails. The thin lines between bands matter: they are policy boundaries rather than battery chemistry, and they should be agreed in writing during the dealer handover instead of discovered en route.
The practical instruction for fleet managers: when you plan the first route, do not divide pack capacity by consumption. Subtract the reserves first, plan against what remains, and commission the charger to a verified state of charge before the truck leaves the yard.
Charger and Vehicle Interoperability and Site Power Readiness
A tractor that arrives on the lot fully charged will not stay that way, and a charger that looks impressive on a datasheet does not automatically feed the truck parked in front of it. The gap between those two statements is where many first-route surprises start. Interoperability is not one checkbox; it is a chain of agreements between connector hardware, software protocol, electrical service, physical layout and weather. Every link has to be confirmed before anyone signs, and the electric semi truck dealer handover is the natural place to close them, while both parties are still in the room.
Connector, Communication, and Handshake Compatibility
Start with the physical interface. Confirm the exact connector family the truck carries and the exact connector the charger delivers. Class 8 equipment may ship with a high-power DC connector, a legacy CCS connector, dual inlets or an adapter strategy, and the charger has to match without field improvisation.
Then look at the conversation behind the copper. Plug-and-charge authentication, ISO 15118 and DIN-based signalling, power-line communication behaviour and the vehicle’s declared charge profile all have to be understood on both sides. A charger running older firmware can negotiate politely with one tractor and stall silently on another.
Finally, bring in the charger’s network and control platform. Confirm which Open Charge Point Protocol version is in use, whether the charger accepts the site’s energy management commands, and whether diagnostics are visible to the fleet rather than only to the installer. Record firmware versions at handover and agree who owns updates afterwards.
Nameplate Power vs. Power the Truck Will Actually Accept
The number on the charger’s label is a ceiling, not a promise. An electric semi accepts power along a curve shaped by pack voltage, cell temperature, SOC and the BMS’s own protective logic. A truck at very low SOC pulls conservatively, opens up through the middle of the window, then tapers sharply as the pack fills.
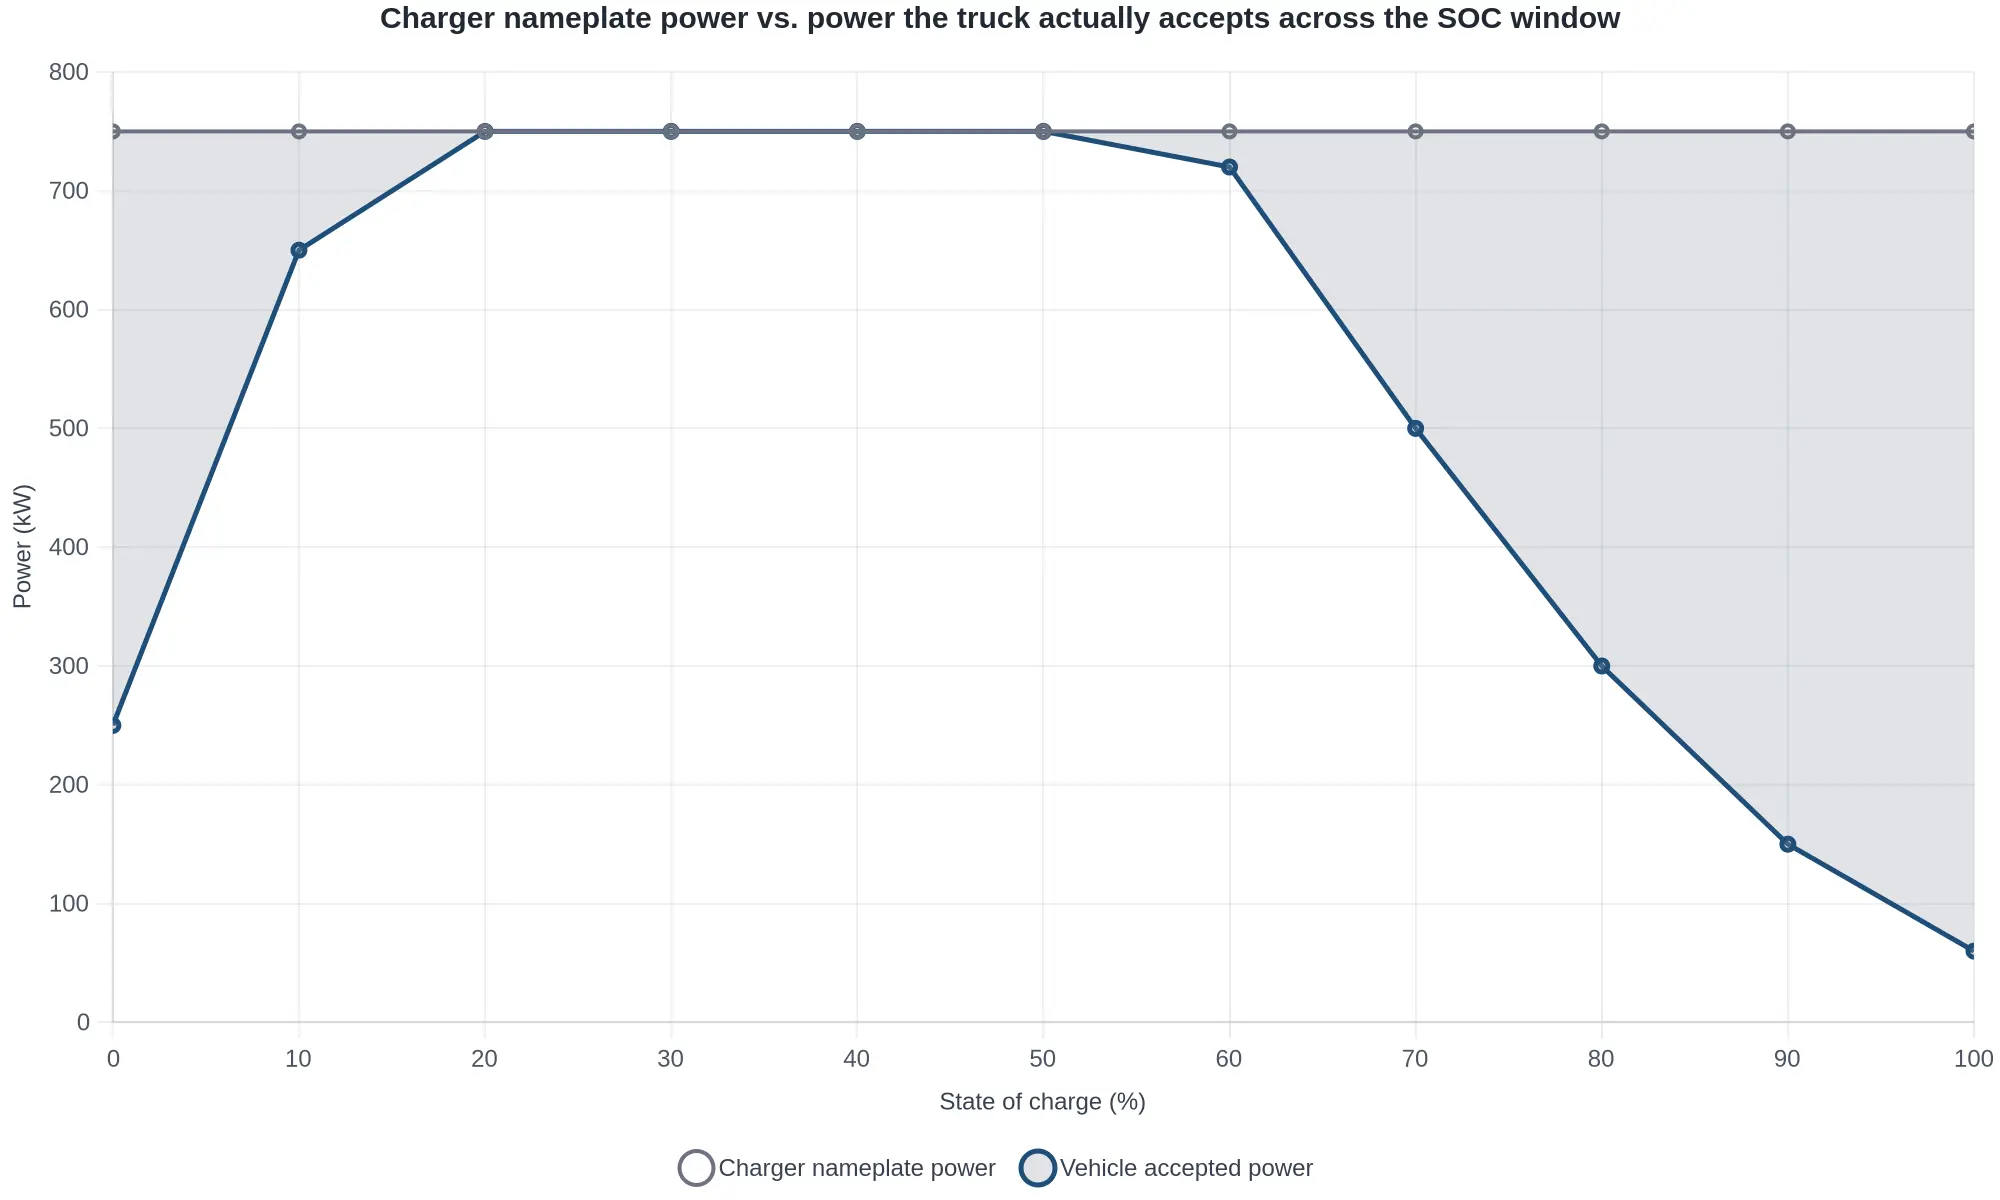
That shaded gap is headroom a fleet pays for and never uses. It matters for planning: two trucks on the same charger can finish hours apart because one was plugged in near empty and the other near full. Ask the dealer for the truck’s charge curve, not just its peak acceptance rate, and compare it with the charger’s curve. Match cable ampacity and connector rating to the sustained figure as well, since a connector rated for a brief peak will heat under a long plateau.
Site Power, Transformer Headroom, and Utility Interconnection
Behind the charger sit a service entrance, a transformer and a utility with its own calendar. Confirm the available capacity at the meter, the transformer’s spare headroom once existing building loads are counted, and the real status of any interconnection request: submitted, studied, approved and energised are four very different states.
Demand charges deserve early attention. Charging several trucks at once can set a monthly billing peak in a single afternoon, and a site that looked economical on energy rates alone may not survive the demand ratchet. Load management and charge scheduling make that peak controllable: staggered starts, power sharing across connectors, departure-time prioritisation and hard site-level caps.
Before signing, the fleet operator should be able to answer these:
- What is the site’s firm available capacity, in kW, with existing loads running?
- How much transformer headroom remains, and who owns the upgrade if it runs out?
- Where does the interconnection request stand, and what energisation date has the utility stated?
- What is the current peak demand, and how would adding chargers change the billing structure?
- How many trucks can charge simultaneously at full rate, and what happens to the rest?
- Is load management configured to protect a site cap, and who can change those limits?
- Which loads are non-essential and could be shed or shifted to off-peak windows?
Layout, Cable Reach, and Conditions That Trigger Derating
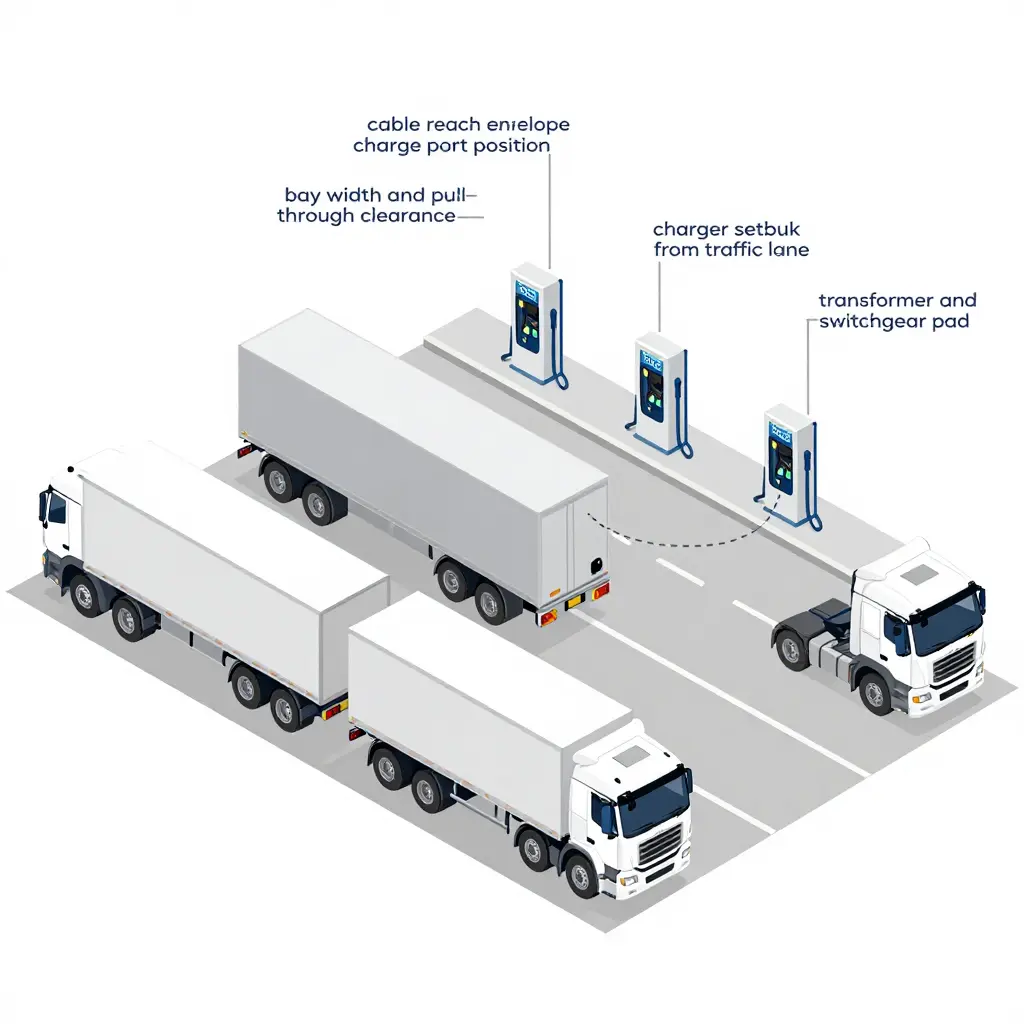
Cable reach is a commissioning constraint dressed up as a construction detail. A charger a metre too far from the charge port forces drivers to nose in at an awkward angle or park outside the painted bay. Check bay width, pull-through clearance, charger setback from the traffic lane, and how the cable behaves when it is cold, stiff and heavy. Cable management hardware is not cosmetic; it decides whether a driver can connect one-handed in the dark.
Ambient conditions then rewrite the power curve. High temperatures push both charger and pack into thermal protection, cutting current. Low temperatures limit charge rate until the pack warms, which delays a departure if preconditioning is not scheduled. Dust, humidity and altitude add their own limits on some equipment. Ask which temperatures trigger derating on each side, and whether the truck can precondition from shore power before a shift.
Good commissioning proves all of it with the tractor attached: a real session, a logged curve, a documented derating threshold and a layout a driver can use without instructions. Anything less leaves the first route to guesswork.
Charger Power vs. Charge Time: Where the Returns Fall Off
A 500 kW charger reads beautifully on a procurement slide, and it is easy to assume it will cut an electric semi’s charging stop to a fraction of the time. It will not. Once the truck’s BMS sets the ceiling, extra charger capacity mostly sits idle.
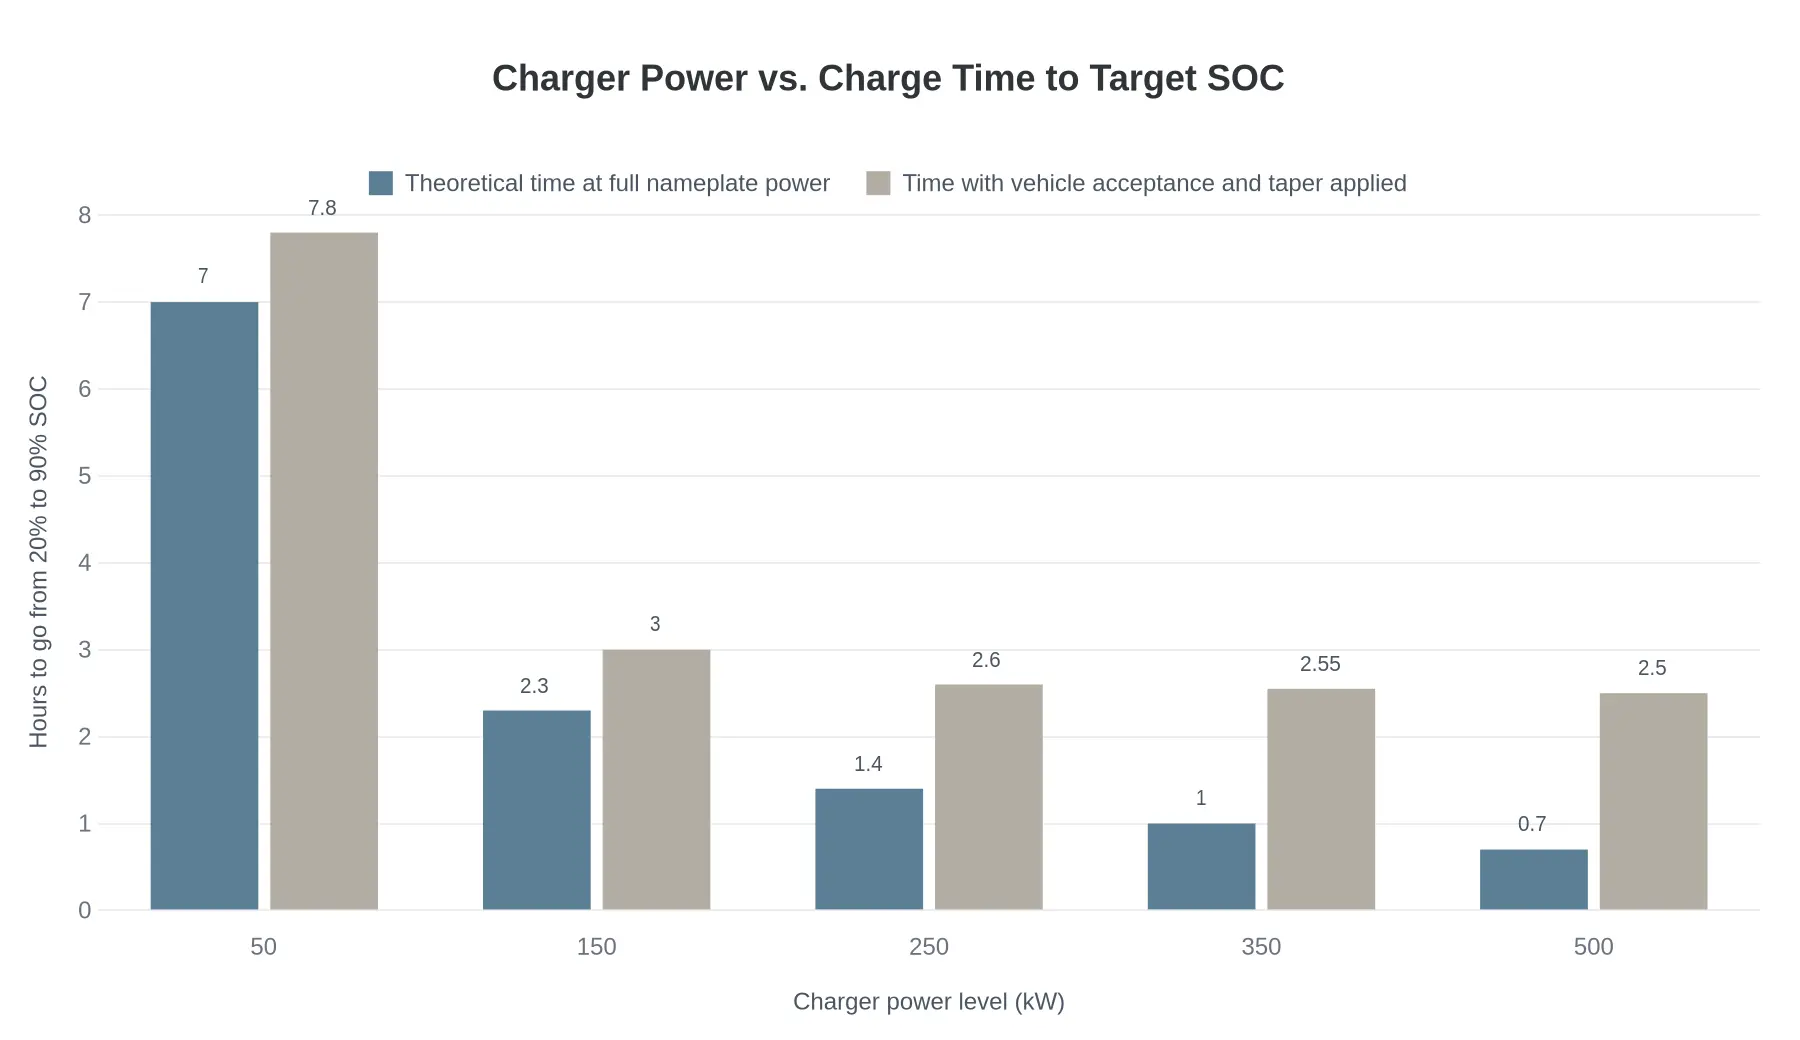
The chart compares two scenarios for the same tractor: a 500 kWh usable pack taken from 20% to 90% SOC, a typical pre-departure top-up. The first set of bars is the textbook calculation, where the pack swallows every kilowatt the charger can deliver at nameplate rating. The second set shows what the vehicle allows, factoring in acceptance limits and the taper that begins as the pack fills.
What the Numbers Say
| Charger power | Theoretical time | Real time (acceptance + taper) | Time gained vs. previous step |
|---|---|---|---|
| 50 kW | 7.0 h | 7.8 h | – |
| 150 kW | 2.3 h | 3.0 h | ~4.8 h |
| 250 kW | 1.4 h | 2.6 h | ~0.4 h |
| 350 kW | 1.0 h | 2.55 h | ~0.05 h |
| 500 kW | 0.7 h | 2.50 h | ~0.05 h |
Going from 50 kW to 150 kW is transformational, turning an overnight-plus session into a long coffee break. Going from 250 kW to 500 kW buys about six minutes in total, roughly three minutes per step. Past that point the charger is no longer the constraint. The vehicle is.
Why the two series diverge
Three effects widen the gap:
- Acceptance ceiling. A battery can only absorb so much current before cell-level limits and thermal management take over. Above that point, additional charger power is refused.
- Taper. Charging current tapers through the upper SOC band to protect the pack. The last stretch from 80% to 90% is deliberately slow, and no amount of nameplate power changes that.
- Hotel loads. HVAC, battery thermal conditioning and 12V systems draw power during the session, which is why real times sit above the theoretical curve even at low charger power.
This matters economically as much as operationally. Oversized DC infrastructure carries a capital cost and often a demand-charge penalty that the charge curve never repays. To see the electricity side of the ledger clearly, it helps to understand what it actually costs to charge an electric truck before committing to 350 kW hardware for a site that will realistically run 200 kW sessions.
What this means for the handover departure SOC
When you set the departure SOC target at handover, build the plan around the truck’s acceptance curve rather than the charger’s badge. A practical sequence for the dealership:
- Benchmark the truck. Pull the acceptance curve from the OEM and confirm the maximum DC input the pack will take at 20-50% SOC.
- Match charger to pack. Size installed power to the truck’s sustained acceptance, plus a modest margin for a second vehicle.
- Time the session honestly. Use real taper figures, then add 15-20 minutes for thermal conditioning and preconditioning.
- Fix the departure SOC. If a full 90% is not achievable in the available window, plan around 75-80% and adjust the first leg accordingly.
This is where a common first-week failure is prevented: a driver leaving at a SOC the route cannot support because the site assumed charger capacity equals charge rate. The truck decides how fast it fills. The dealer’s job is to plan around that, and the numbers above are the starting point.
The Standards Behind a Defensible Handover
Across export markets, charger commissioning and handover are governed less by one global rulebook than by overlapping families of standards, each with a regional bias. AC charging still runs largely through IEC 61851 and SAE J1772 conventions. DC fast charging splits between CCS1 (North America), CCS2 (Europe and most other export destinations) and GB/T 20234 for vehicles built to Chinese norms. High-power three-phase AC for heavy vehicles leans on SAE J3068, and the Megawatt Charging System specification developed through CharIN, still working through IEC/ISO, is the family export buyers are being told to plan around.
Above the connector sits the communication layer: ISO 15118 governs plug-and-charge and bidirectional messaging, while DIN 70121 still turns up in older charger firmware. In practice the consequential commissioning question is rarely which standard is “best”, but whether the truck’s inlet, the charger’s controller and the site’s backend speak the same dialect. Even with an adapter in the middle, a GB/T tractor and a CCS2 charger will not negotiate a session without protocol work. Documentation should state the vehicle inlet standard, the supported protocol versions and any adapter or gateway used.
| Standard family | Typical role in commissioning |
|---|---|
| IEC 61851 / SAE J1772 | AC charging control and connector basics |
| CCS1 / CCS2 / GB/T 20234 | DC fast charging connector and signalling |
| SAE J3068 | Three-phase AC charging for heavy vehicles |
| ISO 15118 / DIN 70121 | Vehicle-to-charger communication, plug-and-charge |
| MCS (CharIN, IEC/ISO track) | High-power charging for long-haul tractors |
Installation, Inspection and Utility Interconnection Norms
Electrical installation conventions follow the jurisdiction, not the vehicle. IEC 60364, with its HD 60364 national adoptions, sets the European baseline for earthing, protective devices, cable sizing and separation of high-current DC circuits. NFPA 70 with Article 625 covers North American practice, frequently amended at state and utility level.
Commissioning is where those documents turn into test records: insulation resistance and earth continuity measurements, loop impedance checks, verification of RCD/GFCI type and selectivity, functional testing of emergency stops, confirmation of charger firmware and protocol versions, and a witnessed charging session at rated power. Utility interconnection adds a second stack of paperwork – load studies, service or transformer capacity confirmation, interconnection applications, protection settings and demand-charge tariff elections. The economics those records underwrite are covered in the analysis of the cost to charge an electric truck.
Published statistics on commissioning failure rates or handover audit outcomes are not consistently comparable across markets, so this section stays qualitative and draws on the structure of standards-body publications and interconnection procedural guidance rather than measured field data.
What the Handover File Normally Contains
Documentation norms for the file itself come from quality-management practice rather than from any vehicle-specific standard: version control, controlled document numbering, VIN-linked records, bilingual or local-language labelling and a signed acceptance page. A well-run electric semi truck dealer handover package ties each of these to the specific chassis, so a warranty claim, a charging fault or an audit can be traced to a named test and a named technician. SOC at handover is normally recorded as a timestamped reading alongside the charging session log, because it is the single figure that most directly decides whether the first dispatched route is achievable.
- Commissioning report – site survey, charger make/model and firmware, connector standard, protocol version, serial numbers, and the results of insulation, earthing and functional tests.
- Utility interconnection file – load study, service capacity or transformer confirmation, interconnection application reference, protection settings, and the applicable tariff.
- Charging session record – witnessed full-power session, start and end state of charge, energy delivered, duration, and any faults logged.
- Vehicle technical dossier – inlet standard, onboard charger rating, DC power ceiling, adapter or gateway details, and any OEM-specific charging restrictions.
- Battery state of charge certificate – timestamped reading at handover plus the ambient temperature at which it was taken.
- Safety and operator pack – emergency stop locations, isolation procedure, arc-flash and PPE guidance, and lockout/tagout instructions.
- Training and competence record – who was trained on the charger and the vehicle, at what level, and on what date.
- Warranty and compliance bundle – registration forms, declaration of conformity or type approval, language variants, and the signed acceptance page with document revision numbers.
Where the First Route’s Energy Budget Actually Goes
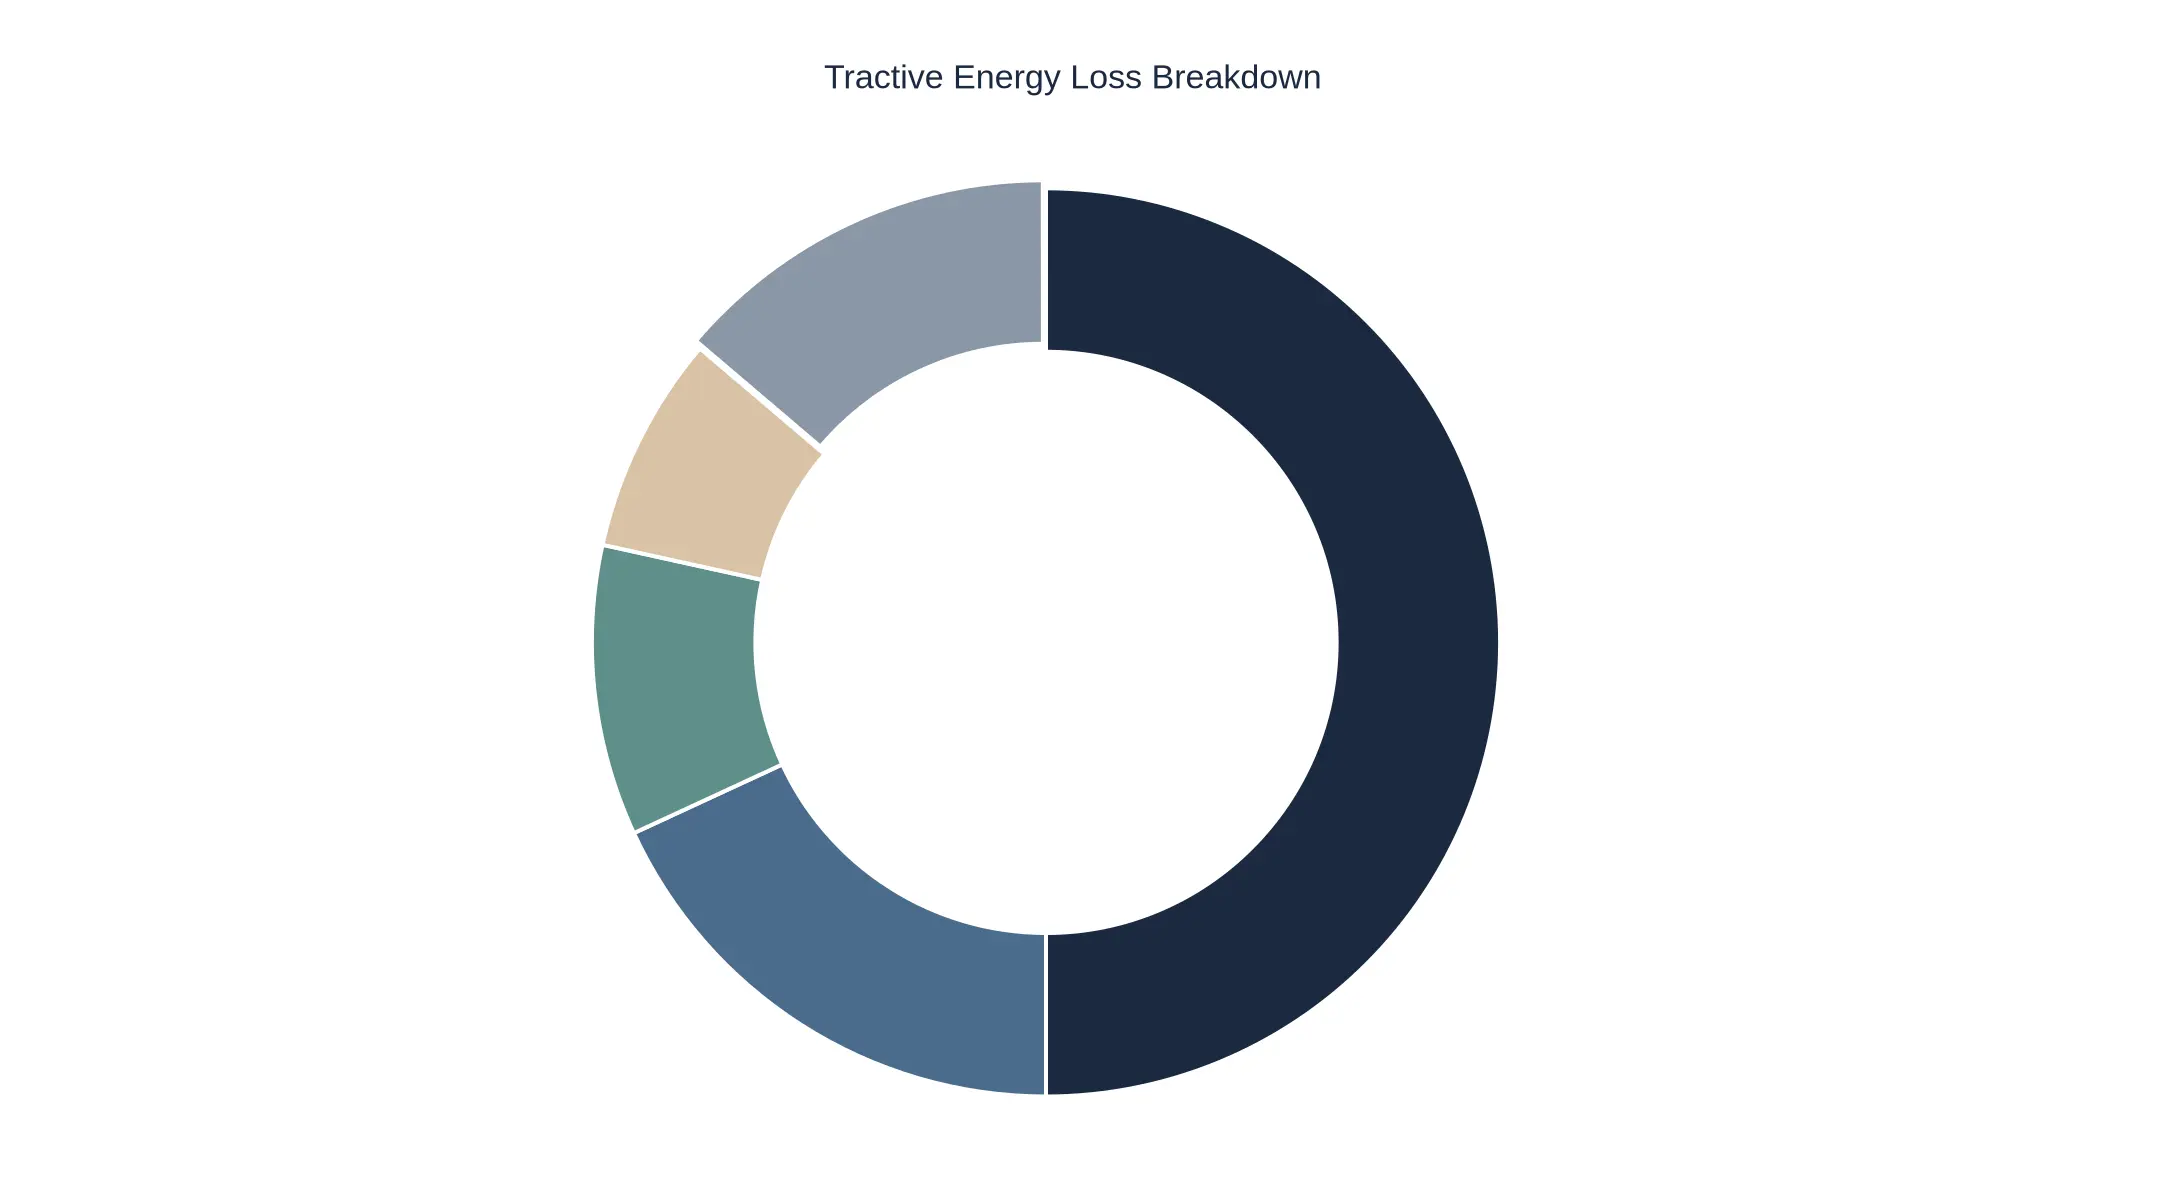
Fleet teams usually model the first post-handover run as a single traction number. A measured budget looks different. Traction work – grade climbing plus rolling resistance – takes roughly 58% of what leaves the pack. Aerodynamic and cruise losses take another 21%, so those two still account for most of the demand. The part worth staring at is the remaining 21%: 12% of discharge goes to HVAC and 9% to auxiliary and 12V loads, and neither scales with distance driven. They scale with time, ambient conditions and whatever the trailer and body builder wired in.
Why the regen credit is not a reserve
The thin detached arc is a credit, not a draw. Regenerative recovery returns about 16% of the energy a rig spends on the first route, which is why it is plotted as a negative share and kept separate from the load wedges. Do not net it out before quoting a usable state of charge. Regen depends on terrain, grade and stop density, so a flat outbound leg on a cold morning can hand back far less than the route profile suggested.
| Category | Share of battery discharge | Why it belongs in the handover model |
|---|---|---|
| Traction on grade and rolling resistance | 58% | Scales with payload, grade and tyre pressure, not with calendar time |
| Aerodynamic and cruise losses | 21% | Rises with speed, especially above roughly 90 km/h (55 mph) and into headwinds |
| HVAC load | 12% | Time-based draw driven by ambient temperature and cab set point |
| Auxiliary and 12V loads | 9% | Body, liftgate, telematics and PTO consumers added after the OEM build |
| Regenerative recovery | -16% credit | Real but terrain dependent, so hold it back as a reserve |
| Net consumption | 84% | The number that should anchor charger commissioning targets |
What this means before the truck leaves the yard
Twelve percent for HVAC and nine percent for auxiliary draw add up to 21% of the budget that has nothing to do with hauling freight – roughly a fifth of the pack spent on keeping the cab comfortable and the body powered. That is part of the handover conversation. A commissioning plan that assumes traction only will understate what the first route needs, and the driver finds the shortfall at the worst possible moment. Adding these lines also forces an honest look at upfit choices, since 12V and auxiliary load management on the body can quietly consume more than anyone planned. Model the budget as five lines instead of one, and the charger target and departure SOC both land in the right place.
Handover Documentation and Sign-Off Package
Six months after delivery, someone will ask why the truck reached the depot at 19% SOC instead of the promised 35%. Either the answer is in the documentation package or it does not exist. Build the package as a deliverable in its own right, not an afterthought stapled to the keys.
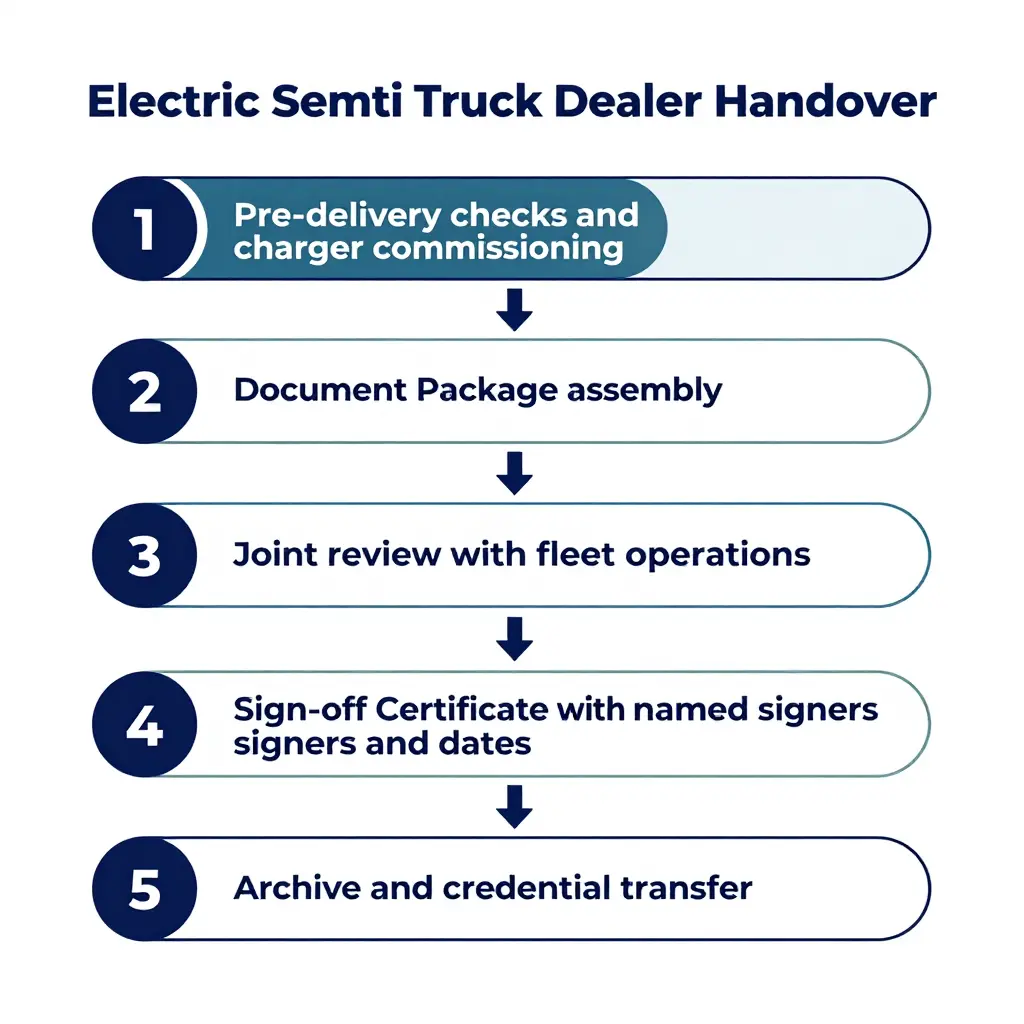
The eight items below are the core of that package. Each has a named signer and a test of validity.
Commissioning report and raw session logs
The report records how the depot charger behaved on the day: handshake protocol, voltage and current ramp, insulation and ground-fault checks, connector temperature, and any error codes raised. The raw session logs – OCPP message exports or CSV session files – go with it, timestamped and traceable by session ID.
Signed by: the dealer’s commissioning engineer, plus the charger OEM field technician where a third party installed the unit. Valid when: the logs cover a complete session in which the truck reached its target SOC. A five-minute test plug-in proves nothing about a full charge curve.
Charger configuration baseline export
A snapshot of the charger as handed over: firmware version, serial number, maximum output current, load-management limits, connector type, cable length and tariff schedule.
Signed by: the commissioning technician and the site’s facility electrician or energy manager. Valid when: the export is generated on the handover date, the serial number on the file matches the physical unit, and the format cannot be silently edited (signed PDF or hashed file).
Battery SOC and state of health report with measurement conditions
SOC at handover, SOH by usable capacity and internal resistance, module balance, min/max cell voltage and pack temperature. The measurement conditions are not optional detail; they are what makes the numbers comparable later. Record ambient and pack temperature, rest period before measurement, test equipment and calibration date, odometer reading, and whether SOH came from a BMS estimate or an actual capacity test. A disciplined battery health and PTO meter inspection routine gives the team reference numbers to trend degradation from day one.
Signed by: the dealer’s high-voltage qualified technician, counter-signed by the fleet’s designated technical representative. Valid when: the conditions are written with actual values, and the reading was taken inside the stated settling window.
BMS fault and event history export
A full diagnostic trouble code list with timestamps, active versus stored status, freeze-frame data, charge cycle count, cumulative energy throughput and any interlock events.
Signed by: the dealer service technician. Valid when: the export is pulled after the final pre-delivery road test, so the last events are included, and the VIN appears on the file.
First-route energy model with assumptions listed
A kWh-per-kilometre model for the actual first route, with every assumption written down: payload and gross combination weight, average speed, grade profile, ambient temperature, HVAC and hotel loads, rolling resistance. Where cab or trailer loads are significant, document how auxiliary power units for semi trucks are accounted for, because parasitic draw is where modelled range usually fails.
Signed by: the dealer’s applications engineer and the fleet’s route planner. Valid when: assumptions are typed rather than verbal, and the model shows arrival SOC with a stated reserve plus a named fallback charger.
Driver and yard briefing sheet
Vehicle-specific charging behaviour: the taper curve, preconditioning, plug-and-charge versus RFID authorisation, cable handling, one-way yard routing, do-not-move SOC thresholds, regen settings and parking brake sequencing.
Signed by: the trainer and every driver or yard operator who attended. Valid when: names or employee IDs and the date are on the sheet, and each driver confirms they have seen the taper curve.
Warranty, service escalation, and spares list
Warranty start definition (in-service date versus delivery date), a coverage matrix for battery, drive motor, inverter, charger and HV harness, an escalation matrix by tier with response times, and a spares list with part numbers and lead times.
Signed by: the dealer’s service manager and the fleet’s maintenance lead. Valid when: the escalation contacts are named people with direct phone and email, and the spares list carries part numbers rather than descriptions.
Telematics and charge-management credentials
Account ownership formally transferred to the fleet, an administrator user created in the fleet’s name, API keys, data retention terms, and the charger-to-vehicle mapping.
Signed by: the dealer’s telematics administrator and the fleet’s IT or operations lead. Valid when: the fleet holds admin rights rather than a shared dealer login, and a password reset is performed on the handover day to prove ownership.
The minimum document set
- Commissioning report with raw session logs attached
- Charger configuration baseline export
- Battery SOC and SOH report with stated measurement conditions
- BMS fault and event history export
- First-route energy model with written assumptions
- Driver and yard briefing sheet with signatures
- Warranty, escalation matrix and spares list
- Telematics and charge-management credentials transfer record
| Item | Signed by | Sign-off is valid when |
|---|---|---|
| Commissioning report and session logs | Dealer commissioning engineer | Logs cover a full session to target SOC |
| Charger configuration export | Technician and site electrician | Serial number and firmware match the unit |
| SOC and SOH report | HV technician and fleet representative | Conditions stated with measured values |
| BMS fault and event export | Dealer service technician | Pulled after the final road test, VIN shown |
| First-route energy model | Applications engineer and route planner | Assumptions written, reserve SOC shown |
| Driver and yard briefing sheet | Trainer and each operator | Names, IDs and dates recorded |
| Warranty, escalation, spares | Service manager and maintenance lead | Named contacts and part numbers present |
| Telematics account credentials | Telematics admin and fleet IT | Fleet holds admin rights, reset performed |
What makes a sign-off valid
A signature without a printed name, job title, date and time is a scribble, not a record. Insist on all four. Where a document cannot be completed on handover day, list it as a conditional item with an owner and a deadline, and have the handover certificate reference that list explicitly.
Digital signatures are fine as long as the platform keeps an audit trail of who signed and when. Revision numbers or file hashes in the handover certificate tie the signed version to the copy in your archive, which matters the first time a warranty claim turns on what the charger was set to on delivery day.
Keep one controlled copy in the fleet’s own document system. A dealer folder on someone’s laptop leaves with that person when they change jobs.
Handover Responsibility Split: Dealer, Fleet Operator, and Utility or EPC
Handover work falls between organisations, which is why experienced buyers scrutinise the electric semi truck dealer site-readiness paperwork before signing. The matrix below sets out who owns, supports or verifies each step, from charger delivery to final release, so nothing is assumed and nothing is done twice.
| Activity | Dealer | Fleet Operator | Utility / EPC | Timing at Handover |
|---|---|---|---|---|
| Site readiness and bay marking | Supports | Owns | Verifies | 4 weeks before |
| Charger delivery and installation | Delivers hardware | Receives | Owns install | 2 weeks before |
| Electrical inspection | Supports | Receives certificate | Verifies and signs off | 7 days before |
| Commissioning test execution | Supports | Witnesses | Owns and executes | Handover day |
| Firmware and configuration baseline | Owns | Verifies version log | Receives record | Handover day |
| SOC and SOH reporting | Owns baseline report | Confirms readings | Receives copy | Handover day |
| Route energy model sign-off | Provides spec data | Owns scenario model | Supports with tariffs | Before first dispatch |
| Driver briefing | Co-delivers | Owns attendance | Supports on charging | Handover day |
| Telematics and billing setup | Supports | Owns accounts | Verifies meter mapping | Handover day |
| Load management configuration | Supports | Provides load profile | Owns setpoints | Handover day |
| Spares and warranty registration | Owns | Receives confirmation | Receives copy | Within 5 days |
| Final release authorisation | Signs vehicle release | Signs acceptance | Signs energisation release | Handover day |
Print the matrix, attach it to the acceptance pack, then walk it line by line with the dealer, fleet manager and utility representative in the same room. Ownership gaps usually hide in the passive rows – records that are “received” but never checked. Put a name against every cell before the keys change hands, and revisit the matrix whenever a new site or route is energised.
Dealer Selection and Buyer Guidance: What to Require at Handover
For a fleet owner, the handover meeting is an acceptance test, not a ceremony. A battery-electric semi either leaves that yard as a fully commissioned asset or as an open warranty dispute waiting for its first cold morning. The difference is almost never the specification sheet. It is what the dealer was contractually obliged to finish, document and prove before the invoice cleared.
Buyers who treat electrification as a long-term operating decision rather than a vehicle purchase negotiate handover terms accordingly – a discipline visible in this analysis of electric trucks as the future of smart, sustainable and cost-effective logistics. Put the requirements below in the purchase agreement, not in a verbal assurance at delivery.
Make final acceptance conditional on completed commissioning
State plainly that final acceptance, and the release of final payment, happens only when commissioning is complete and documented. At minimum that means the charger or depot charging equipment is installed, energised and load-tested; the vehicle has completed at least one full charge event on your site; charger-to-vehicle communication (OCPP or the OEM equivalent) is confirmed; and a SOC report has been generated from the truck’s own BMS and telematics data rather than from a handheld readout at the dash. Define the acceptance tolerances and name the person authorised to sign off. Without that clause, a truck that charges at 60% of rated power is technically delivered.
Decide in advance who pays for re-commissioning
Re-commissioning happens in a minority of deliveries: a failed charger module, a firmware mismatch, an auxiliary battery flattened in transit, a site visit to correct a communication fault. Whoever pays should be settled at signature, not diagnosed in dispute. A simple cost-allocation table removes most of the argument.
| Scenario | Recommended responsibility |
|---|---|
| Fault in charger or EVSE supplied by dealer | Dealer bears parts, labour and site visit |
| Firmware or configuration error present at delivery | Dealer bears reflash and retest |
| Site power or civil work outside dealer scope | Buyer, with dealer support on request |
| Damage or misuse after acceptance | Buyer |
The commercial logic is straightforward. Re-commissioning costs are small against the vehicle price and large against a first-month operating budget, which is one of several reasons operators weigh the full economics before committing – see why your business should consider electric trucks.
Require a documented departure SOC recommendation tied to your routes
A dealer should hand over a written departure SOC recommendation matched to your route profile rather than a generic percentage. It has to account for grade, payload, ambient temperature, cabin and reefer load, available charging windows and the state of health of the specific pack in that truck. Ask for the modelling assumptions in writing. One figure copied across a fleet is a red flag; a route-by-route recommendation is what a professional supplier provides.
Confirm charger spares and firmware support in writing
Electric semis are rarely grounded by drivetrain failures. They are grounded by a charger module on backorder. Require a spares list with part numbers, stated lead times and the minimum stock the dealer or importer holds in your region. Separately, pin down the firmware policy: update cadence, notification process, remote versus on-site execution, and the ability to roll back a release that degrades range or charging behaviour.
Insist on documentation in your market’s language
For international buyers the documentation package matters as much as the hardware. Commissioning records, SOC methodology, charger manuals, safety labelling and warranty terms should arrive in the language of the buyer’s market, in a format your regulators and insurers accept. Re-translating technical documents after delivery adds error and delay that no discount offsets.
Contract clauses to request
- Final acceptance and final payment conditional on a signed commissioning report.
- Verified SOC report generated from vehicle BMS data, attached as an acceptance annex.
- Cost allocation for re-commissioning, including site visit and labour.
- Written departure SOC recommendation matched to each route profile.
- Charger spare parts list, lead times and regional stock commitment.
- Firmware update, notification and rollback obligations with response times.
- Full documentation package in the buyer’s market language.
A B2B supplier such as EV Special Trucks supports custom configurations and full-set export solutions for international dealers and fleet partners, which means the commissioning record, spares schedule and documentation set can be prepared once and reused across a multi-unit order instead of rebuilt per vehicle. That consistency is what makes handover scale across a growing fleet.
Frequently Asked Questions: Charger Commissioning and First-Route SOC
These come up most often in the last week before an electric semi goes into service. Each answer can be checked against the handover sheet.
What does charger commissioning include at handover?
A load test proving the installed unit delivers rated output to the truck; a functional test of the connector, cable and communication protocol (CCS1, CCS2, GB/T or MCS as specified); ground-fault and insulation resistance checks; confirmed firmware versions; and configured load-management and demand-response settings. The technician runs a metered session and records start and stop commands, delivered energy in kWh and any fault codes. The output is a signed commissioning report, which is a separate document from the vehicle delivery paperwork and should be accepted before the first dispatch.
What battery state of charge should an electric semi truck leave the dealership with?
For trucks heading straight into service, a verified 90% to 100%, with the higher end preferred if the first leg exceeds roughly 200 km or ambient temperatures sit near or below freezing. Dealers often store trucks at around 80% for pack health, but a first-route handover is a different case: the vehicle has to cover its assigned route plus a 15% to 20% reserve. Put the delivered SOC, with a timestamp, on the handover sheet.
Can the first route proceed if only part of the commissioning is complete?
No. It should not proceed unless both the charger commissioning test and the pre-trip vehicle checks are signed off. Partial commissioning – a charger that energises but has never been load-tested under real demand, for instance – leaves the fleet unable to prove the charging path works. If a documented exception is unavoidable, limit the route to a distance the truck can cover on delivered SOC alone without relying on the untested charger, and record the exception in writing. Operations should treat incomplete commissioning as a no-dispatch condition.
How is SOC verified independently of the dashboard display?
Read the BMS over the diagnostic link and compare pack voltage, cell-group voltages and reported ampere-hours against a calibrated clamp meter or the charger’s metered energy. A charge session gives a second cross-check: metered kWh delivered divided by usable pack capacity yields an expected SOC gain. A discrepancy above 2 to 3 percentage points usually points to calibration drift or a weak module. Export the BMS reading rather than photographing the dash, so the fleet holds an auditable record.
Does charger power rating determine charging speed on the first route?
No. Charger power is only a ceiling; actual speed is set by the lowest limit in the chain. The truck’s onboard charger and pack acceptance rate, the charger’s real output at site voltage and temperature, cable and connector thermal limits, and the SOC-based charging curve all constrain the session. A 350 kW charger may deliver well under 200 kW to a semi parked at 80% SOC in cold weather. Validate delivered power with a timed session during commissioning instead of planning around nameplate figures.
What documents should the fleet operator receive at handover?
A signed charger commissioning report with measured output and fault logs; a battery SOC and BMS health record timestamped on the delivery date; vehicle delivery and warranty documents; charge-port and protocol specifications; and the charging session log for the delivery charge. Add site electrical drawings, as-built load calculations, the O&M manual, the spare-parts list, current firmware versions for truck and charger, and named warranty contacts. Log anything missing as an open item on the handover sheet, which is standard practice at a reputable electric semi truck dealer.
How does ambient temperature change the departure SOC recommendation?
Cold raises the recommended departure SOC and makes preconditioning mandatory, because a cold pack accepts charge more slowly and releases less usable energy. Below roughly 0°C, target 95% to 100% and start cabin and pack preconditioning 45 to 90 minutes before departure while still plugged in, so the energy comes from the grid rather than the battery. Above 30°C, a high SOC combined with heat accelerates degradation, so departing at 80% to 90% with active cooling is preferable when the first leg allows it.
Who pays if the charger fails its commissioning test?
The party responsible for the installation, which in most contracts means the charging infrastructure contractor, or the dealer when the charger came as part of the vehicle package. Failures traced to utility supply, site wiring or customer-furnished equipment fall to that party under standard contract terms. The remedy normally covers re-testing at no charge plus any rescheduled delivery or dispatch costs. Confirm the responsibility matrix and acceptance criteria in writing before signing, because the handover sheet is what triggers warranty and remediation obligations.
Conclusion
A first route is feasible only when two things are true at the same moment: the charger has been commissioned, and the pack carries a defined state of charge at handover. Neither rescues the other. A well-installed charger cannot compensate for a truck released at 40%, and a full battery cannot carry a morning shift if the depot charger has never been load-tested.
Treat handover as one joint release decision, not two separate tasks. That means a signed commissioning record with a verified power draw and a confirmed handshake, a measured SOC from the BMS rather than a nominal capacity figure, reserves built in layers by route, terrain, payload and temperature, and a named owner for the charger, the charging and the sign-off. Documentation does the rest: it is what protects the fleet when a fault appears at 2 a.m. or a warranty claim turns on what the charger was set to on delivery day.
EV Special Trucks, as a professional B2B supplier of electric special trucks, supports international dealers and fleet partners with custom configurations and full-set export solutions. That support covers specification alignment, charging interface confirmation and the documents that accompany each unit. Dealers who want to see how these handover practices fit a wider distribution model can read more in our electric semi truck dealer guidance. The aim is a release process predictable enough that the first route starts on schedule and the truck stays in service.