

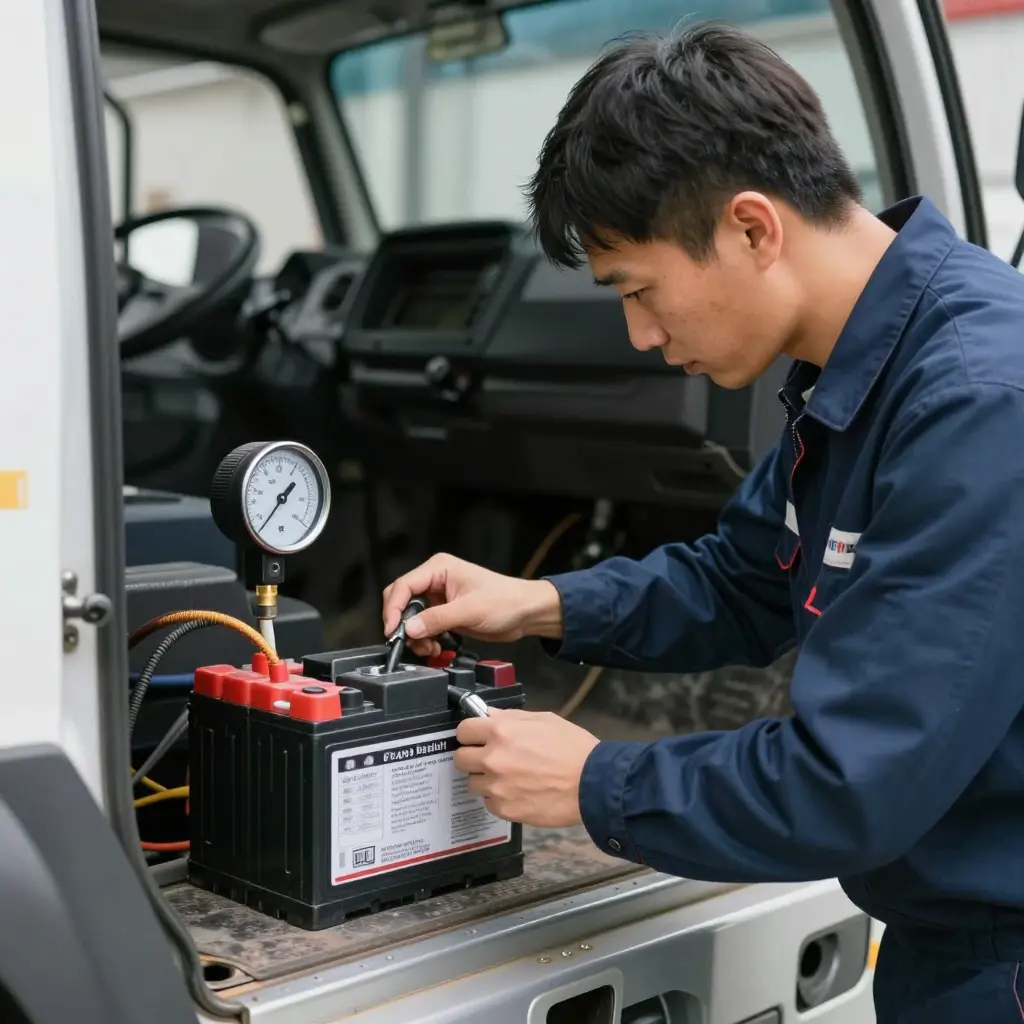
Introduction: Electric Work Truck Inspection as a Core Maintenance Discipline
Electric work truck inspection has matured into a core maintenance discipline for fleets running battery-electric vocational vehicles. The reason is practical. A diesel truck hides much of its wear in oil, coolant, and exhaust; an electric truck reports it as data – cell voltages, pack temperature, PTO hours. Supervisors who turn those readings into a written procedure get more predictable uptime, safer drivers, and a cleaner compliance record.
A workable protocol rests on two readings. The first is battery state of health (SOH), which covers usable capacity, cell balance, and how far the pack has aged from its original rating. The second is the PTO hour meter, which counts power take-off engagement and shows how hard cranes, compactors, and hydraulic lifts actually work the truck.
SOH sets remaining range, how quickly the pack accepts charge, and whether a warranty claim will hold. PTO hours expose the duty-cycle stress that wears out pumps and motors long before mileage would suggest. Read together, they tell a maintenance manager more than either gauge can alone.
As electric work trucks scale across fleets, those two numbers will shape uptime planning and total cost of ownership. Logging SOH and PTO hour meter telemetry in the same workflow as every other service check is what keeps unplanned downtime down and asset value up over the full service life.
A diesel work truck inspection revolves around oil analysis, coolant chemistry, exhaust aftertreatment, EGR, injectors, and fuel filters. An electric truck has none of those parts, so those checks disappear. Engine hours stop being the master wear clock, and the technician’s first question shifts from combustion condition to electrical integrity.
The high-voltage pack becomes the costliest wear item on the asset, replacing the engine. That puts battery SOH, cell-group balance, insulation resistance, thermal-management fluid condition, and pack sealing on the inspection sheet. Because degradation is gradual and invisible between services, the SOH trend matters more than any single spot check.
Motor controllers, inverters, DC-DC converters, and contactors now carry the load that pistons and crankshafts once did, so diagnostics turn electrical. Inspectors check connector torque, high-voltage cable chafing, isolation faults, and cooling-loop integrity instead of belts, hoses, and gaskets. Test equipment, technician certification, and lockout procedures all have to match the higher voltage.
Body equipment runs from an electric power take-off (e-PTO) or an auxiliary power unit, which changes what the hour meter means. The PTO hour meter counts equipment-on time, not engine-on time, and aerial buckets, refuse compactors, and hydraulic pumps can keep working while the traction system sits idle. Treat those counters as duty-cycle inputs for battery SOH planning, not as engine-hour equivalents. Auxiliary and 12V loads need their own checks too, since they sit outside the traction pack (managing 12V loads in work truck upfits).
Treating an electric work truck like a diesel unit invites missed faults and inflated downtime.
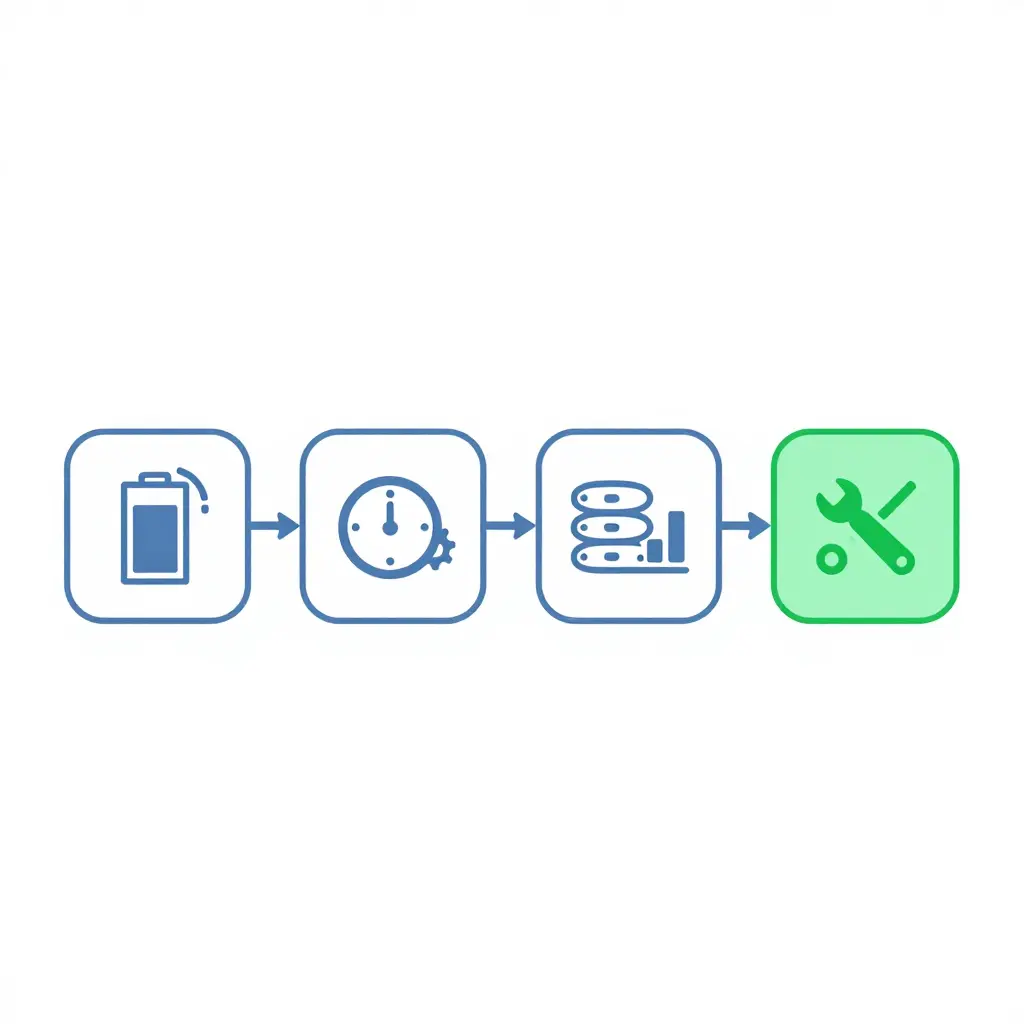
The diagram shows the sequence. A battery state-of-health (SOH) assessment captures remaining capacity and degradation trends. A PTO hour meter reading records how long the power take-off has actually been under load. Both feed a data logging step that builds a consistent service history, and that history drives the final maintenance decision: keep the truck in service, schedule service, or flag it for deeper diagnostics. Run the same loop every time and scattered checks become a fleet maintenance program you can defend. See how electric work trucks for sale are specified for exactly this kind of duty-cycle monitoring.
Battery State of Health (SOH) Fundamentals for Electric Work Trucks
Battery state of health (SOH) measures how much usable energy an electric work truck’s pack can still deliver compared with the day it left the factory. It is a percentage: current usable capacity divided by the original rated capacity. A 200 kWh pack that now accepts only 170 kWh of usable energy reports 85% SOH. For a fleet evaluating battery state of health on electric work trucks, that one number sets realistic route range, payload duty cycle, PTO runtime, and residual asset value. State of charge tells you how full the pack is right now. SOH tells you how much it has permanently aged.
The Three Mechanisms That Lower Battery SOH
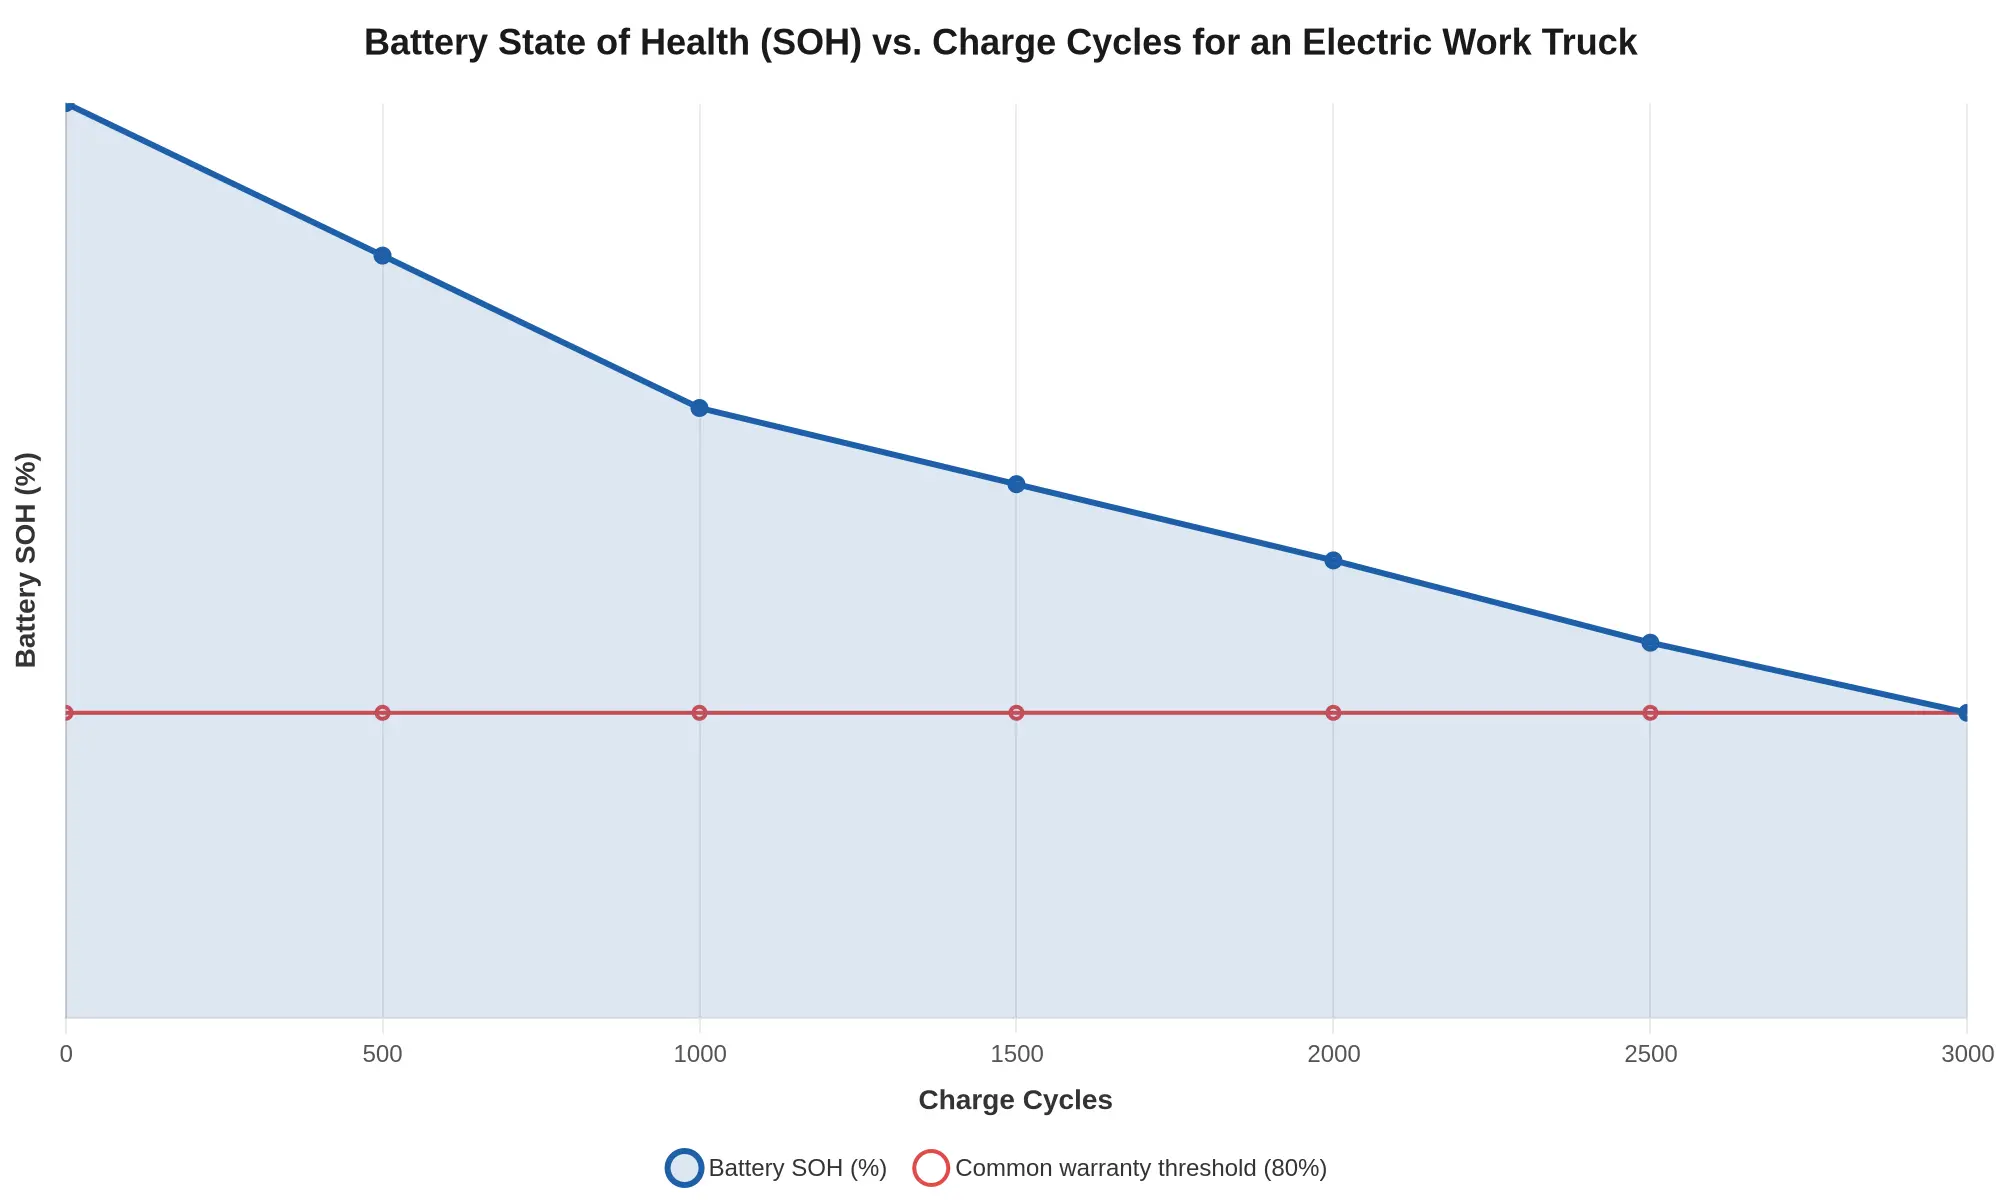
Capacity fade. Capacity fade is the irreversible loss of lithium inventory and active material inside the cells. Every charge and discharge cycle consumes a fraction of usable capacity, and sustained high temperatures, deep discharges, and frequent DC fast charging speed the loss. A truck cycling daily will show measurable capacity fade within two to three years, and SOH drops with it.
Internal resistance. As cell chemistry ages, internal resistance rises and voltage sags under load. The extra resistance wastes energy as heat, cuts the peak power available to hydraulic or PTO-driven equipment, and lowers fast-charge acceptance. A rising resistance figure is often the first aging signal the BMS reports.
Cell imbalance. Cell imbalance is the drift in voltage and capacity between cells wired in series. One weak cell limits the whole string: the BMS stops charging before the healthy cells are full, and effective range shrinks. Persistent imbalance is also an early warning of pack failure.
How Battery State of Health Is Measured
Full-charge/discharge testing. This benchmark method charges the pack to 100% and discharges it under a controlled load to measure true usable capacity. It is the most accurate way to get SOH, but it is slow, ties up the truck, and stresses the pack.
Partial cycling. Partial cycling measures capacity across a narrow state-of-charge window and estimates SOH through incremental capacity analysis. It is faster, needs less downtime, and fits routine interval checks.
Onboard BMS telemetry logs. The battery management system (BMS) logs state of charge, cell voltages, temperatures, and current continuously. Those logs expose capacity fade and cell imbalance trends over time, so a fleet can track SOH with no downtime at all.
Battery State of Health Inspection Metrics
The ranges below turn raw SOH readings into maintenance decisions. They assume a generic EV work truck battery pack (roughly 100-250 kWh, NMC or LFP chemistry) under mixed duty cycles with PTO-driven loads. When a metric crosses its warning threshold, move from routine monitoring to a targeted diagnostic before the next revenue service block. Pair these checks with proper management of 12V auxiliary loads so parasitic draw does not drain the high-voltage pack between shifts.
Reference Ranges and Warning Thresholds
| Metric | What It Measures | Typical Warning Threshold | Recommended Inspection Interval | Inspection Method |
|---|---|---|---|---|
| State of Health (%) | Remaining usable capacity versus the pack’s original rated capacity | Below 80% | Quarterly | BMS diagnostic scan plus periodic full capacity/range test |
| Internal Resistance (mOhm) | Resistance to current flow across cells and interconnects, signaling aging, heat build-up, and power fade | Above 2.5 mOhm per module | Every 6 months, or after any thermal event | AC impedance test or DC load-step pulse measurement |
| Cell Voltage Delta (mV) | Voltage imbalance between the highest and lowest cells at rest | Above 50 mV | Monthly | Cell-level voltage readout via the BMS |
| Charge/Discharge Efficiency (%) | Round-trip energy efficiency, i.e. energy returned versus energy delivered | Below 90% | Quarterly | Metered charge/discharge energy logging |
| Battery Temperature Spread (C) | Temperature difference between the hottest and coolest module under load | Above 5 C | Monthly, or continuous via telematics | Onboard thermal sensors with spot checks by IR thermography |
Turning Readings Into Action
Treat the thresholds as tripwires, not pass/fail limits. One over-limit reading earns a re-test under controlled conditions; a metric that stays out of band across two consecutive checks points to a module that should be isolated and replaced. EV work trucks spend a lot of time stationary or running PTO equipment, so watch temperature spread and cell delta most closely. Those two show up before the pack visibly loses range or stops accepting charge the way it used to.
Battery State of Health Inspection Checklist
Run these checks in the same order at every service interval, so your electric work truck inspection stays fast, repeatable, and audit-ready. For fleets adding zero-emission assets, pairing this routine with well-specified electric work trucks for fleet duty keeps baseline data comparable across the whole roster.
- Retrieve the latest BMS SOH report – capture the most recent battery SOH snapshot before anyone touches the pack.
- Verify cell voltage delta stays within tolerance – flag any delta above 50 mV as a warning for the next cycle.
- Log pack temperature during load – record peak temps while the truck is working under real load, not at rest.
- Compare current capacity against the baseline commissioning value – quantify usable kWh fade since day one.
- Record internal resistance trend – track the rise per module across the last three inspections.
- Check SOC vs. voltage curve alignment – confirm the reading matches expected open-circuit behavior.
- Review charge and discharge cycle count – reconcile the counter with logged PTO and drive hours.
- Inspect coolant flow and thermal management loops – verify no leaks, blockages, or pump faults.
- Scan for active or stored BMS fault codes – clear only after the root cause is documented.
- Check busbar and connector torque – confirm no loosening, corrosion, or hot-spot discoloration.
- Validate balancing performance – ensure the BMS completes cell balancing within the expected window.
- Archive the report against the truck’s VIN – build the historical trail your warranty claims depend on.
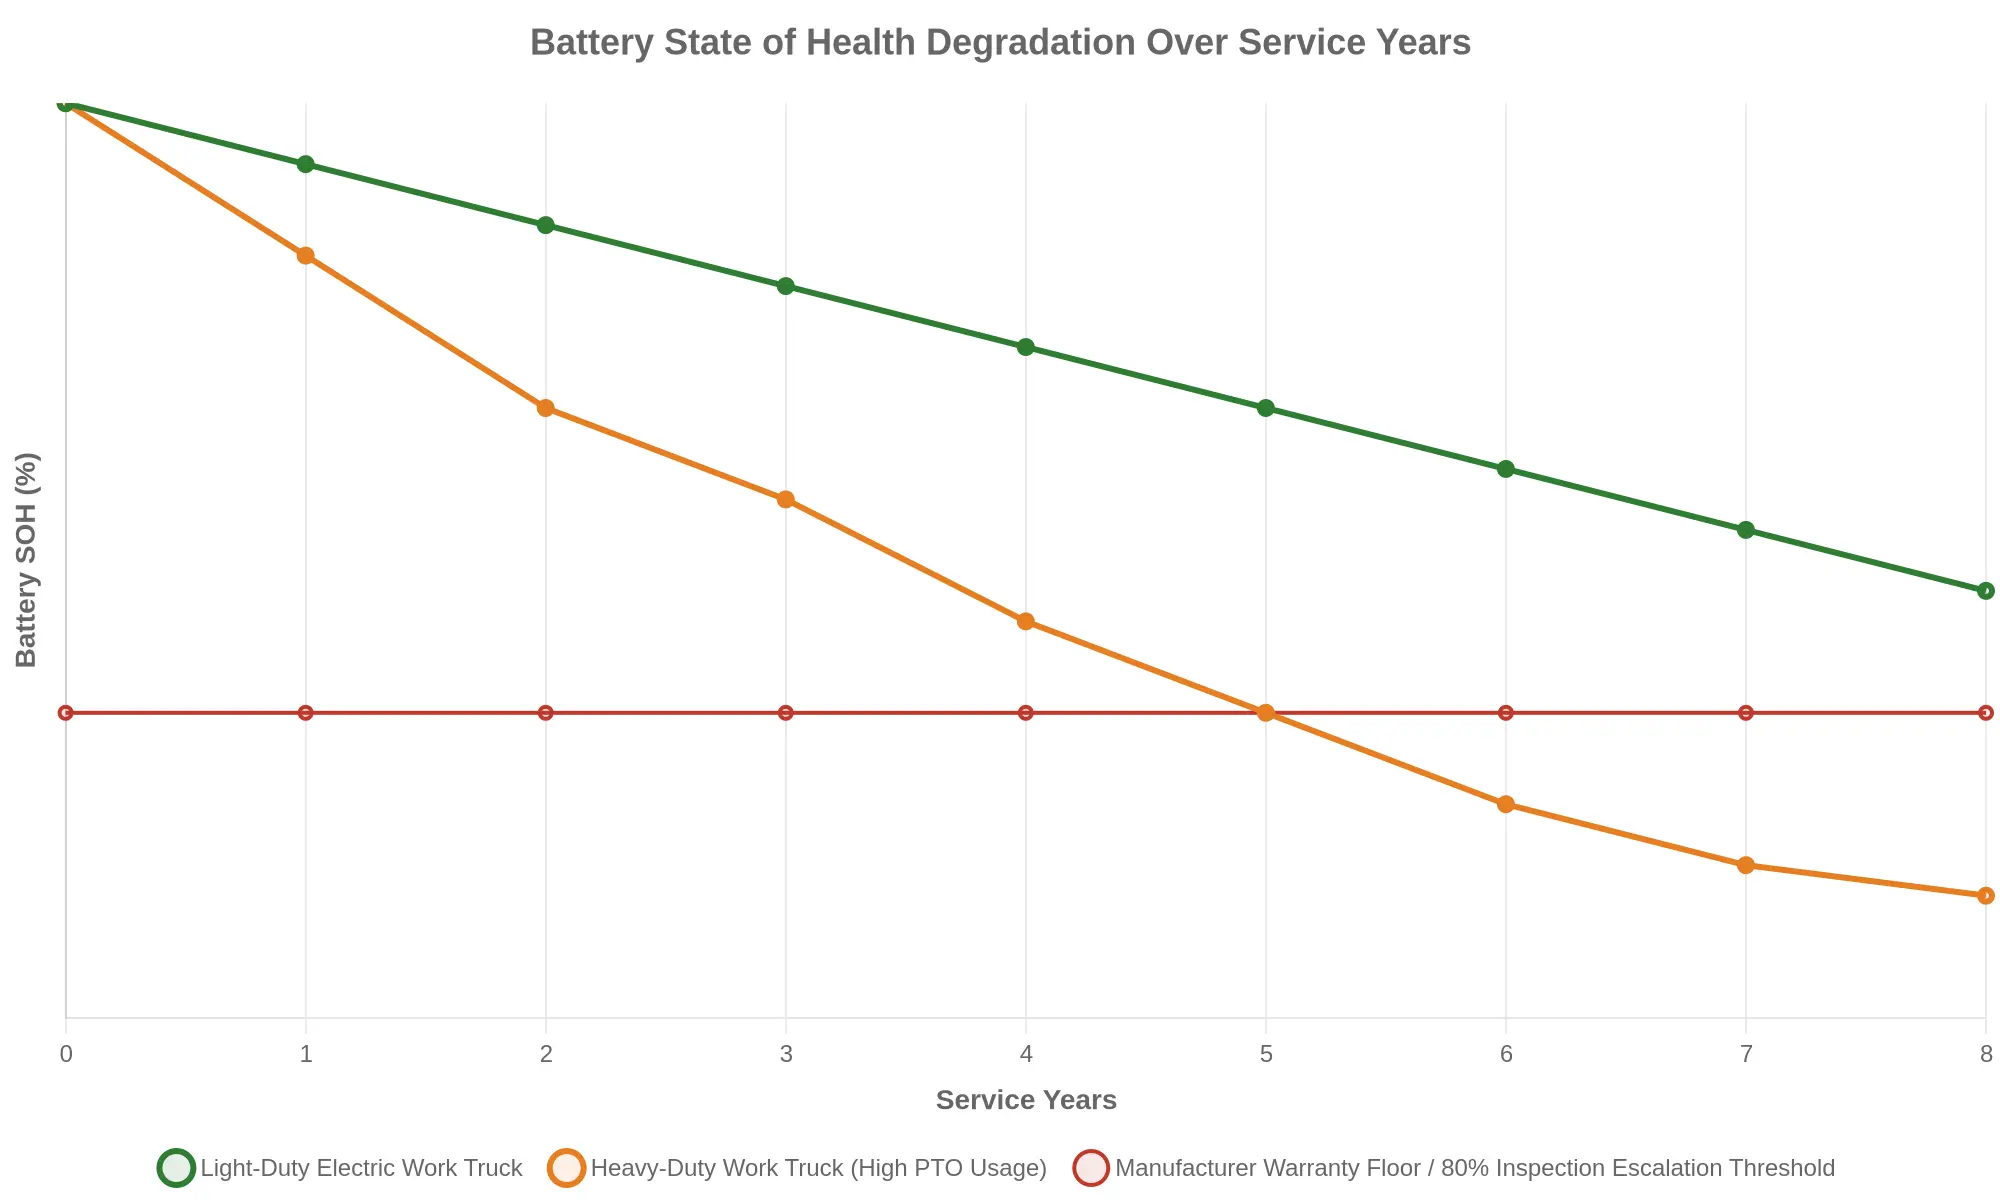
Figure 1 – Battery State of Health Degradation Over Service Years. Two identical 100 kWh electric work truck packs, two duty cycles. The light-duty unit fades gently to roughly 84% SOH after eight years. The heavy-duty truck running high PTO (power take-off) loads falls steeply, crossing the 80% inspection escalation threshold around year five and reaching about 74% by year eight. That gap shows PTO-driven load, not calendar age alone, is the dominant driver of capacity fade and rising internal resistance. Treat 80% SOH as the trigger for escalated diagnostics, including a full auxiliary and PTO-driven load audit. Any unit below that line needs documented duty-cycle evidence before anyone touches a cell.
PTO Hour Meter Fundamentals for Electric Work Trucks
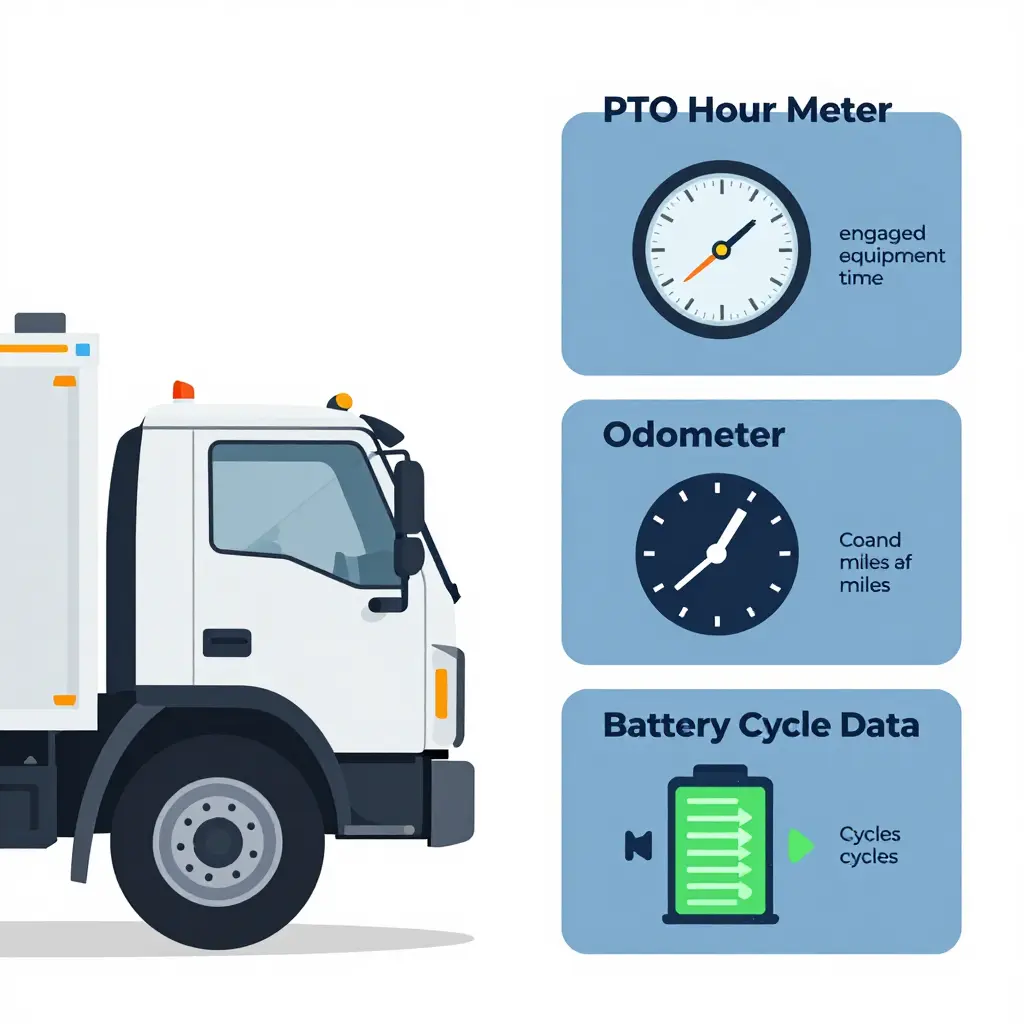
A PTO hour meter is a dedicated counter that records the cumulative time a power take-off or auxiliary hydraulic or electrical system is engaged, independent of vehicle motion. On an electric work truck, the meter logs runtime whenever the PTO or auxiliary circuit is active, whether the chassis is parked at a job site or moving slowly along a route. It answers one question: not how far the truck traveled, but how long its work equipment actually operated.
The difference from an odometer matters for maintenance planning. An odometer counts distance, capturing wear tied to the driveline and chassis as the vehicle moves. A PTO hour meter counts time, capturing wear tied to stationary or low-speed equipment operation. On a refuse truck or bucket truck that idles for hours each shift, mileage alone badly understates how hard the auxiliary system is working.
Battery cycling data is an entirely separate metric. The BMS tracks charge and discharge cycles, depth of discharge, and state of health. Those figures describe energy moving into and out of the pack. None of them says how long a hydraulic pump or auxiliary load ran, which is why PTO hours get read alongside battery data, not instead of it.
Three categories of activity accumulate as PTO hours. Each reflects genuine equipment duty:
| Activity Type | What It Captures |
|---|---|
| Equipment running time | Aerial lifts, cranes, compactors, refrigeration |
| Hydraulic pump activation | Pump engagement and pressurized flow cycles |
| Auxiliary load draw | 12V/24V systems, tool circuits, and lighting |
Why PTO hours matter for scheduling service. Hydraulic pumps, PTO shafts, control valves, and auxiliary motors wear with operating time, not mileage, so a service interval written in hours matches the wear. Skip the meter and you get unscheduled failures; track it and service becomes a planned event. Fleet operators running mixed routes can read more on managing 12V auxiliary loads on electric box trucks.
PTO Hour Meter Inspection Procedures
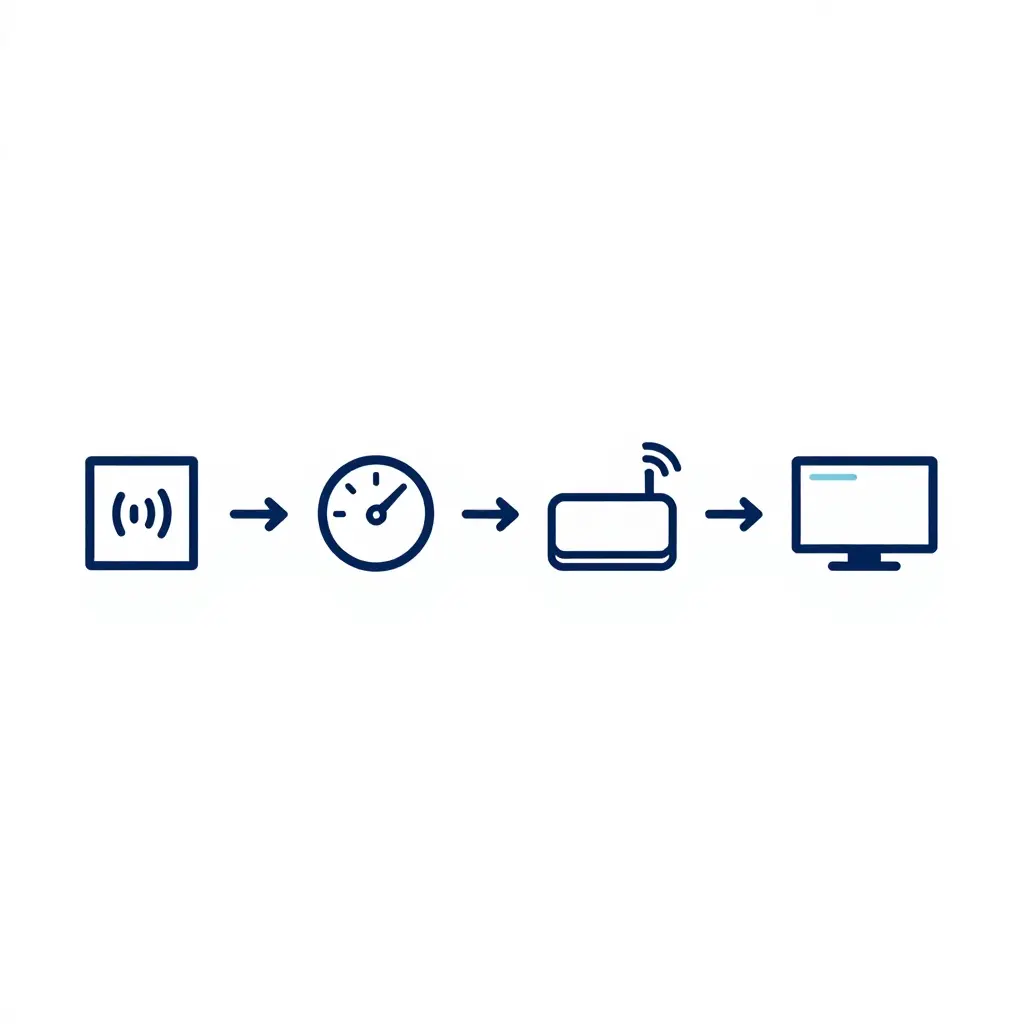
The PTO hour meter records how long a power take-off has driven the hydraulic and auxiliary systems on an electric work truck. Since those hours set component service timing, confirm meter accuracy at every electric work truck inspection. Work through the sequence below and write each result into the maintenance record.
Confirm Sensor Connection Integrity
- Inspect the sensor connector and pigtail for corrosion, chafing, and moisture intrusion.
- Verify the pulse signal reaches the vehicle controller with a diagnostic reader.
- A sensor disconnection is the most common failure mode: it freezes the meter instead of stopping the PTO, so the truck keeps working while logging no time.
Check Accuracy Against Telematics
Cross-reference the dash meter against telematics logs for the same operating interval. A gap larger than two percent means drift or intermittent signal loss; document it and resolve it before the unit goes back into service. This is the quickest check that the displayed PTO hour meter value reflects real run time.
Detect Drift and Resets
Watch for sudden drops to zero or weekends that show no accumulation. Counter resets often follow firmware updates that reinitialize non-volatile memory. Before flashing any controller, record the current PTO hour value, then re-check it afterward and note any change.
Align PTO Hours with Service Schedules
Map accumulated PTO hours to hydraulic fluid, filter, and pump intervals. If the meter undercounts, auxiliary systems run well past their service life. Good management of auxiliary 12V loads on upfitted trucks keeps those circuits stable and the meter honest.
Track each reading, discrepancy, and reset so drift trends become visible across the entire fleet.
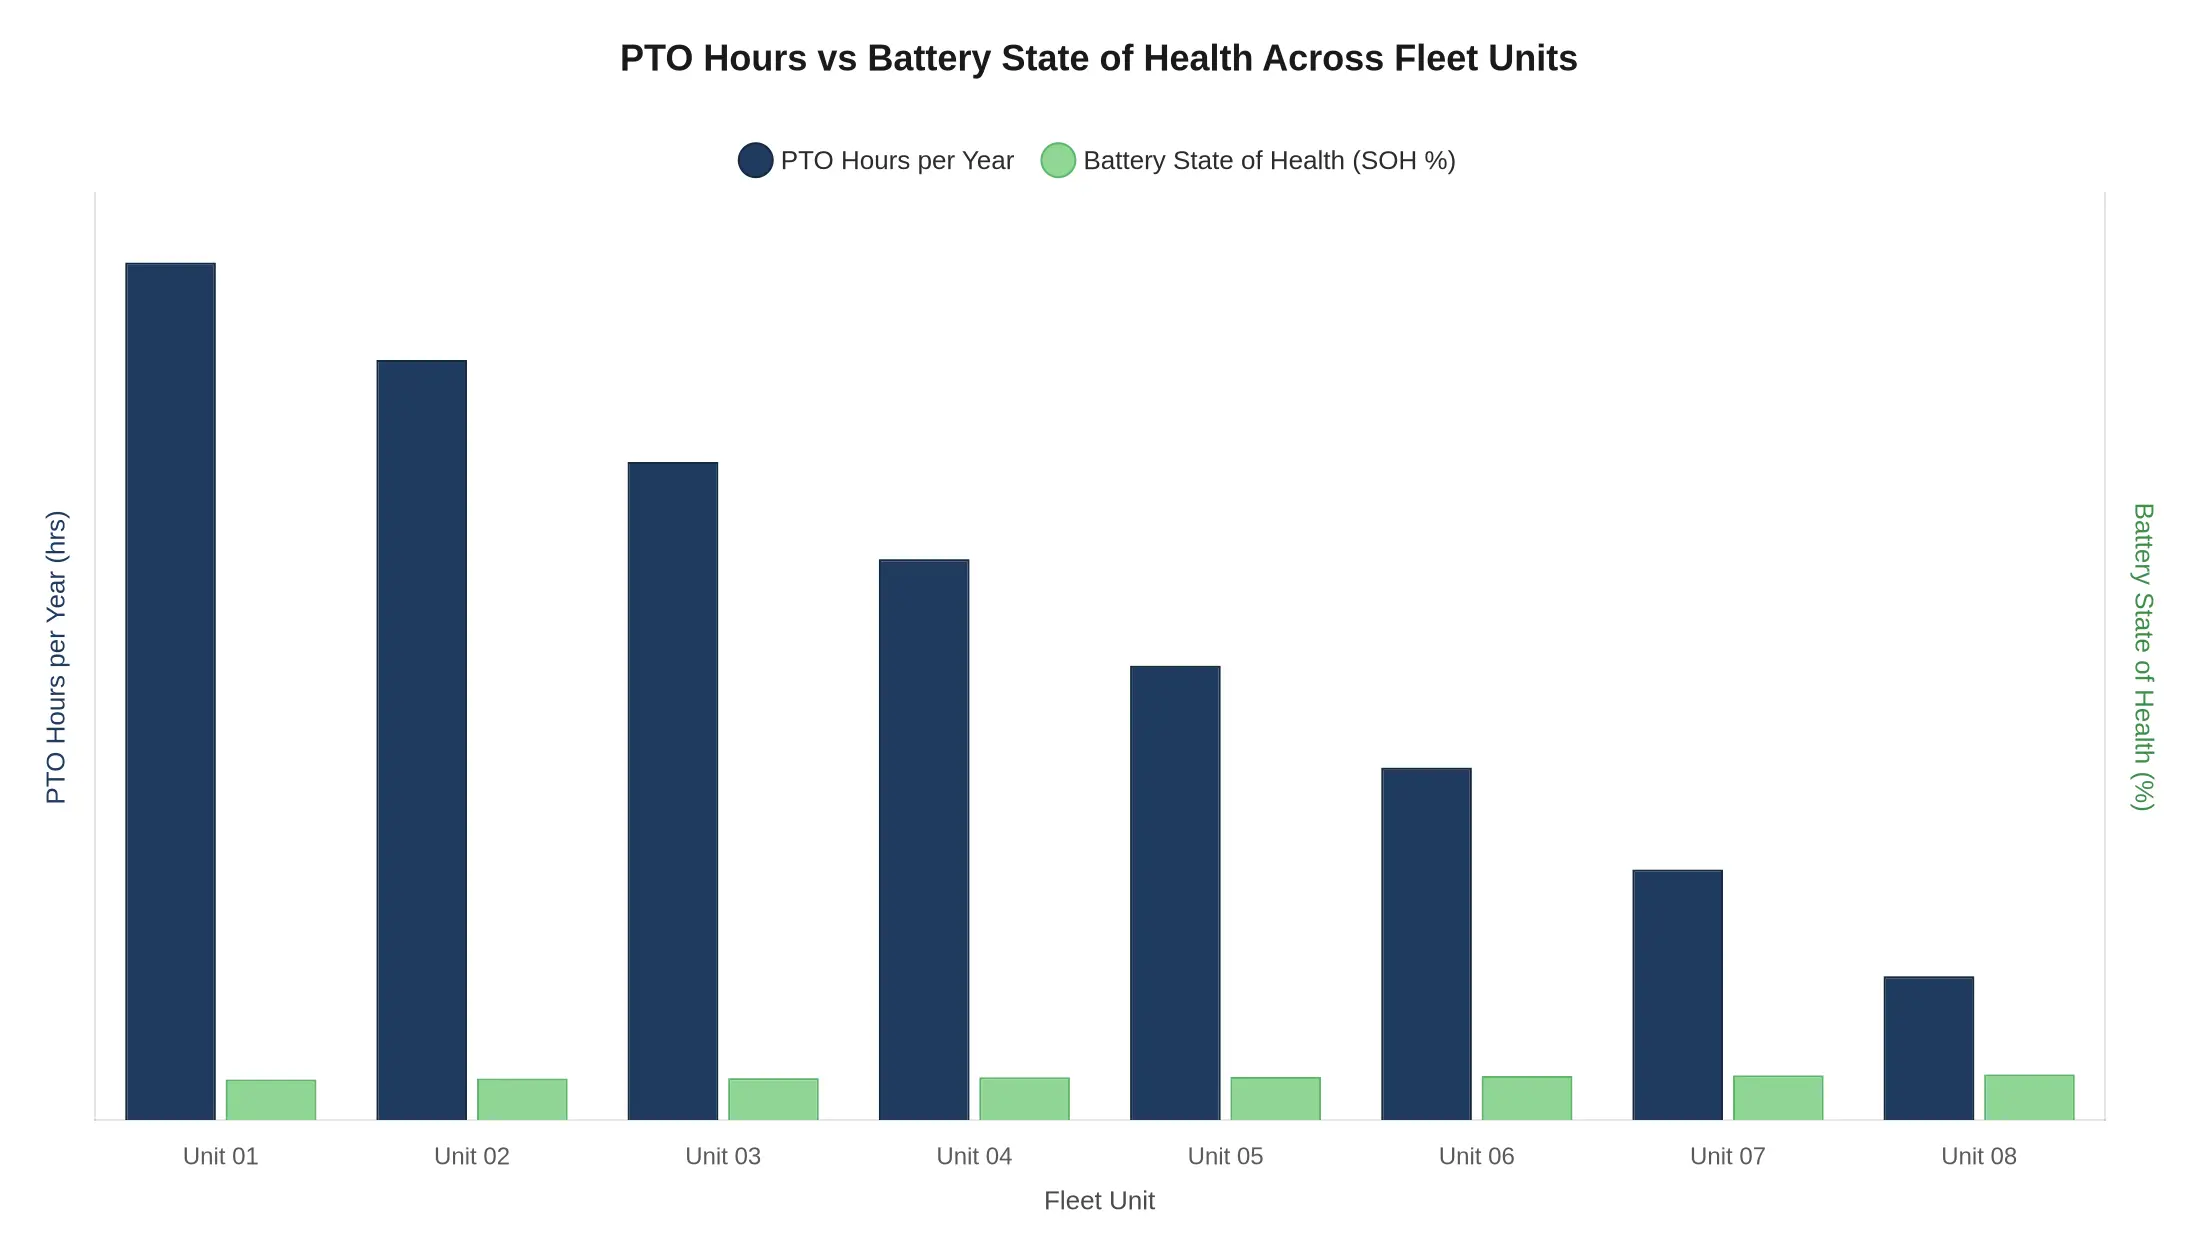
Figure: PTO Hours per Year vs Battery State of Health (SOH %) Across Eight Electric Work Truck Units
Caption: Across the fleet, the units with the most annual power take-off (PTO) hours have the lowest battery state of health. Unit 01 logs roughly 1,850 PTO hours at 87% SOH; Unit 08 logs 310 hours at 98% SOH. The inverse pattern points to stationary PTO duty, which holds the pack under sustained load and thermal stress, as the faster path to aging. Shorten inspection and cell-balancing intervals for high-PTO units, and flag anything above roughly 1,400 annual PTO hours for quarterly SOH testing instead of the standard annual review.
Correlating Battery SOH with PTO Hour Meter Data
Every electric work truck inspection should begin by logging battery state of health, the ratio of present usable capacity to rated capacity. One reading is noise; the trend line is the signal. Record SOH monthly and normalize it against pack age and accumulated charge cycles.
The PTO hour meter quantifies duty severity. It logs hours the power take-off has run driving hydraulic pumps, compactors, or refrigeration units. High PTO hours mean sustained current draw, higher cell temperatures, and deeper discharge cycles than the mileage would suggest.
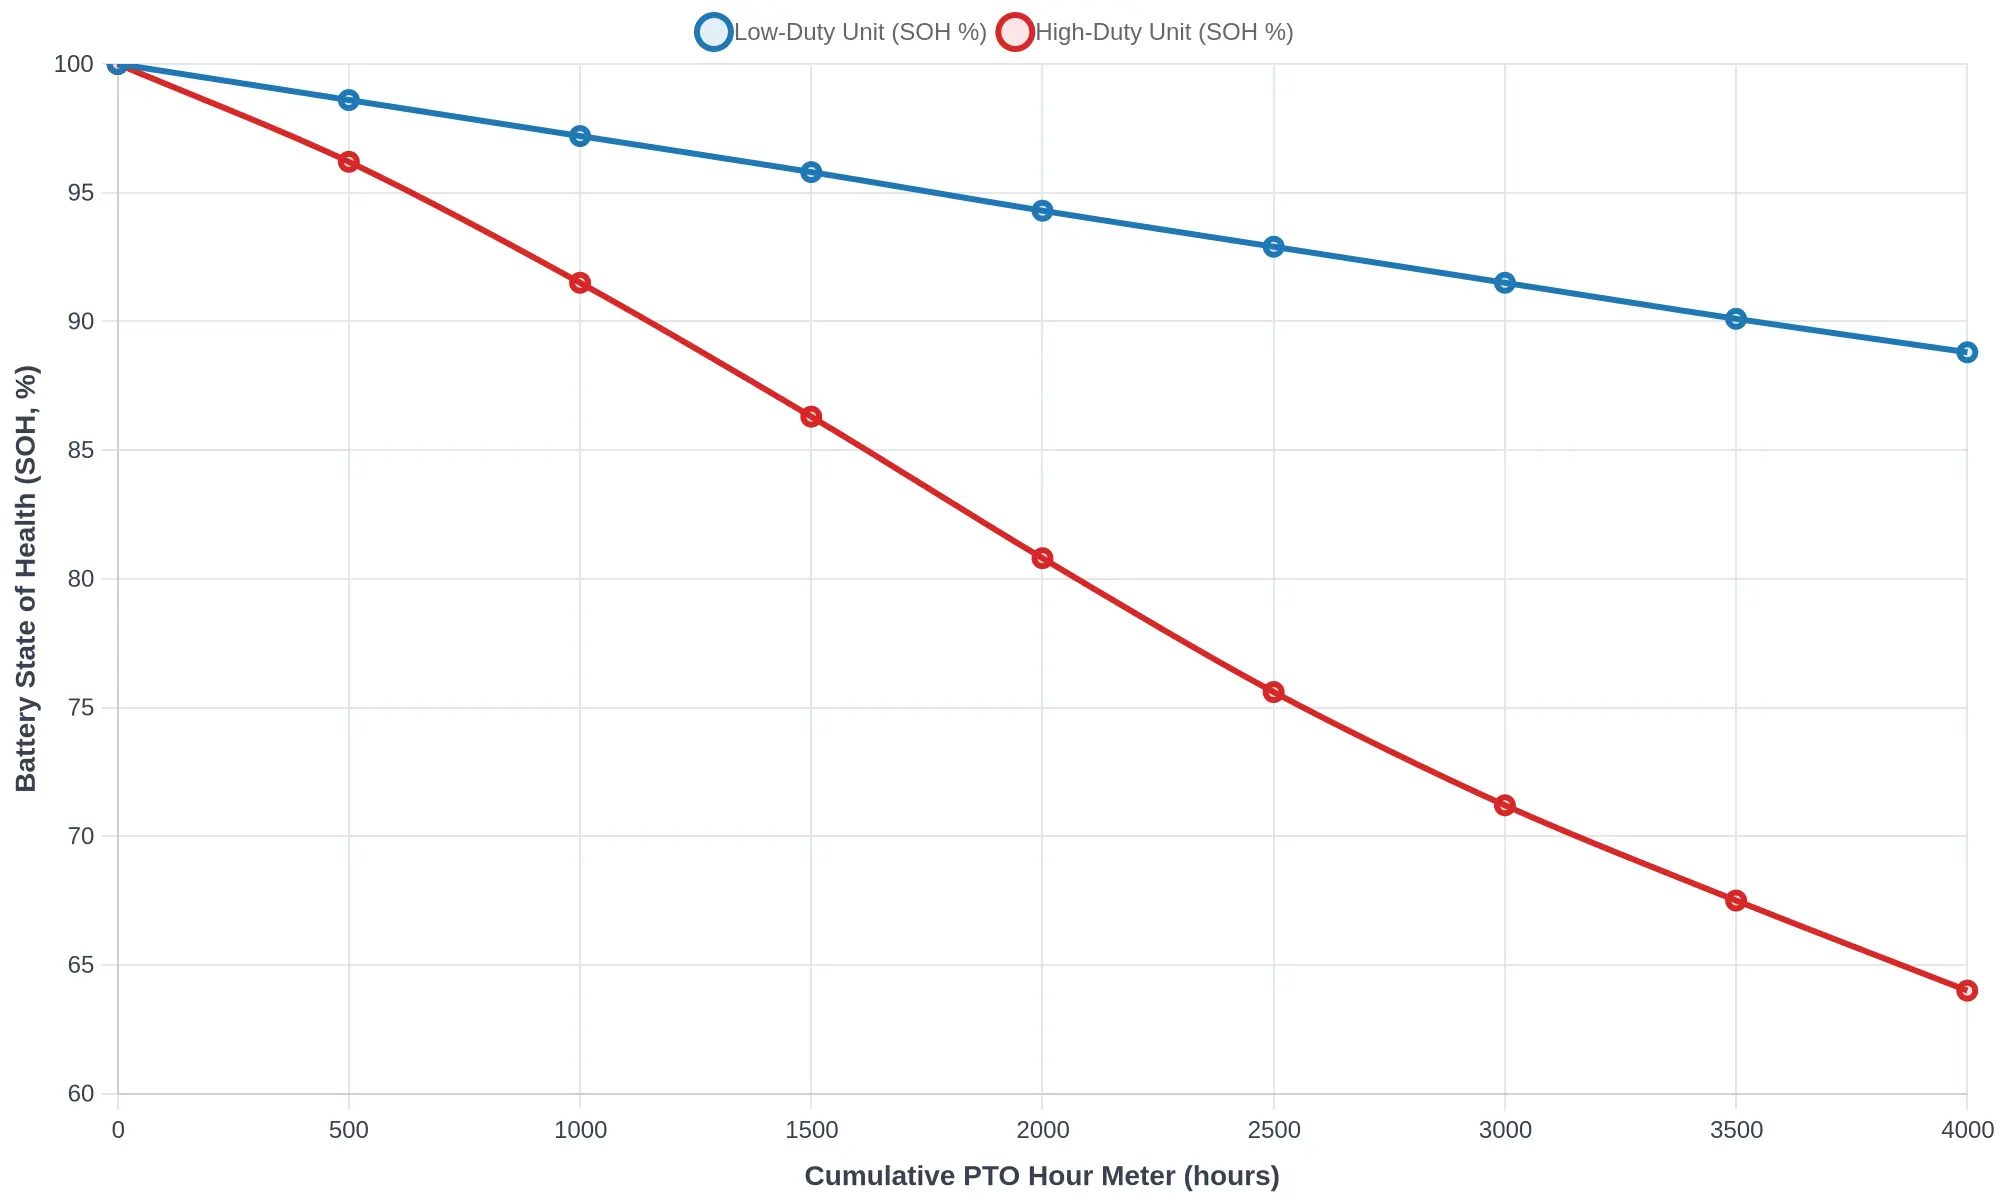
Read together, the two metrics expose accelerated wear. When climbing PTO hours line up with a steepening SOH decline, degradation is running ahead of calendar aging. Either metric alone misleads; together they isolate the units that are abusing their packs. The chart below contrasts a low-duty unit holding above 88% SOH against a high-duty unit falling below 80% across 4,000 PTO hours.
Build a service trigger matrix. Cross-referencing SOH bands against cumulative PTO hours turns guesswork into a set of deterministic actions.
| SOH Band | <1,500 PTO hrs | 1,500-3,000 PTO hrs | >3,000 PTO hrs |
|---|---|---|---|
| >90% | Monitor | Routine inspection | Check thermal management |
| 80-90% | Routine inspection | Inspect and log | Deeper diagnostics |
| <80% | Inspect and log | Deeper diagnostics | Priority service |
Prioritize units for deeper diagnostics. Rank the fleet by a combined score weighting SOH slope and PTO utilization. Send cell-level testing, capacity audits, and thermal imaging to the lowest-ranked units first, before they reach warranty exposure or failure thresholds.
Benchmark against the fleet, not the datasheet. Compare each truck’s SOH per PTO hour against the fleet median, not the nameplate rating. Outliers flag accelerated wear that a datasheet will never reveal. Pairing SOH trends with PTO utilization turns raw telemetry into a prioritized, defensible inspection queue for your fleet-ready electric work trucks.
Recommended Inspection Intervals by PTO Utilization Tier
Translating telematics into a maintenance calendar is where EV fleets save money or quietly lose it. The matrix below matches each PTO utilization tier to a cadence for battery state-of-health (SOH) checks and PTO hour meter verification, turning two data streams into one concrete inspection schedule. Pair it with proven 12V load-management practices to keep auxiliary systems and instrumentation accurate between service events.
| PTO Utilization Tier | Annual PTO Hours | Battery SOH Check Frequency | PTO Hour Meter Verification Frequency | Escalation Trigger |
|---|---|---|---|---|
| Light – intermittent, seasonal auxiliary use | Up to 300 hrs | Quarterly (every 90 days) | Semi-annual | SOH falls below 90% or logged PTO hours exceed forecast by 15% |
| Moderate – routine daily auxiliary work | 300-800 hrs | Quarterly (every 60-90 days) | Quarterly | SOH falls below 88% or degradation exceeds 3% per quarter |
| Heavy – high, continuous PTO demand | 800-1,500 hrs | Monthly | Monthly | SOH falls below 85% or cell voltage delta exceeds 50 mV |
| Severe – near-continuous duty cycles | Over 1,500 hrs | Bi-weekly (every 14 days) | Bi-weekly | SOH falls below 80%, thermal alarm, or PTO-to-odometer ratio drift above 25% |
How to read this matrix: match your fleet to the tier whose annual PTO hours fit your duty cycle, then lock the corresponding SOH and hour-meter cadences into the shop calendar. Any escalation trigger is a hard stop. Pull that vehicle out of scheduled service and into a diagnostic review before the next dispatch.
FAQ: Battery SOH and PTO Hour Meter Inspection for Electric Work Trucks
What battery state of health percentage indicates a battery needs replacement?
Most OEMs and fleet engineers treat SOH below 70% of rated usable capacity as the point to start planning replacement; some warranty actions trigger closer to 65%. Between 70% and 80%, a pack is usually flagged for enhanced monitoring rather than immediate replacement. On an electric work truck, degradation accelerates once SOH falls under 70%, so operators comparing electric work trucks for sale should weigh projected capacity against their real duty cycles.
How often should the PTO hour meter be inspected on an electric work truck?
Verify the PTO hour meter at every scheduled preventive maintenance interval – for most vocational fleets, every 250 operating hours or quarterly, whichever comes first. Because electric work trucks run auxiliary equipment while stationary, the meter often advances faster than the odometer and has to be logged on its own. Compare the accumulated total against telematics records to catch tampering or sensor faults.
Can battery state of health recover after balancing?
Yes, when the loss comes from voltage divergence rather than physical degradation. A balancing cycle on an electric work truck can recover several percentage points by equalizing the weakest series string, but it cannot reverse chemical aging. If SOH does not rebound after balancing, the loss is structural, and replacement or module service should be scheduled.
Does high PTO usage void battery warranty?
No. High PTO usage alone does not void a battery warranty; coverage typically voids only when load, thermal, or duty-cycle limits in the owner’s manual are exceeded. On an electric work truck, sustained auxiliary draw beyond the rated continuous output can trigger an exclusion clause. Document PTO hour meter data and keep it inside manufacturer specifications to preserve full coverage.
What is the difference between PTO hours and odometer mileage?
PTO hours measure how long power take-off and auxiliary systems have run; odometer mileage tracks distance traveled by the electric work truck. Stationary tasks such as lift operation, refrigeration, or hydraulic work push hours up while mileage barely moves, so the two metrics describe different wear patterns. Track both: a truck with low mileage but extreme PTO hours may need a battery state of health assessment long before its odometer suggests one.
Conclusion: Making Inspection a Competitive Advantage
For a cost-effective EV fleet, reliable electric work truck inspection is no longer a box to tick at the end of a shift. Three habits carry most of the value.
Monitor battery state of health continuously instead of waiting for a failure. Trend cell balance, capacity retention, and charge acceptance over time so degradation shows up long before it strands a crew.
Let data, not the calendar, drive the maintenance schedule. Pairing PTO hour meter readings with telematics and work-cycle logs tells you when auxiliary loads and battery duty have actually stressed a truck, so you service the assets that need it.
And treat early detection of capacity fade as a KPI. Catching a 3-5% drop in usable range in month one is far cheaper than replacing an entire pack in year three.
For fleets ready to put these practices to work, EV Special Trucks is a B2B supplier of high-performance electric special trucks, offering custom configurations and full-set export solutions tailored to your duty cycles. Comparing inspection data across platforms is also easier when you understand where the market is heading, which is why staying current on the future of smart, sustainable logistics pays off.
Actionable recommendation for fleet maintenance managers: standardize a monthly battery state-of-health and PTO hour meter inspection protocol across your fleet, log the results in a shared dashboard, and set automatic alerts for any capacity fade above 3%. Do it now, and you extend pack life, reduce unplanned downtime, and protect your total cost of ownership.